Home Lab Project
A tour of my home lab
As part of my hobby, I designed and implemented network infrastructure at my house for security and experimentation. I created a personal cloud using four NAS servers totaling 92.6TB in RAID 5 for photo syncing, backups, media streaming, and surveillance, providing cost-effective solutions.
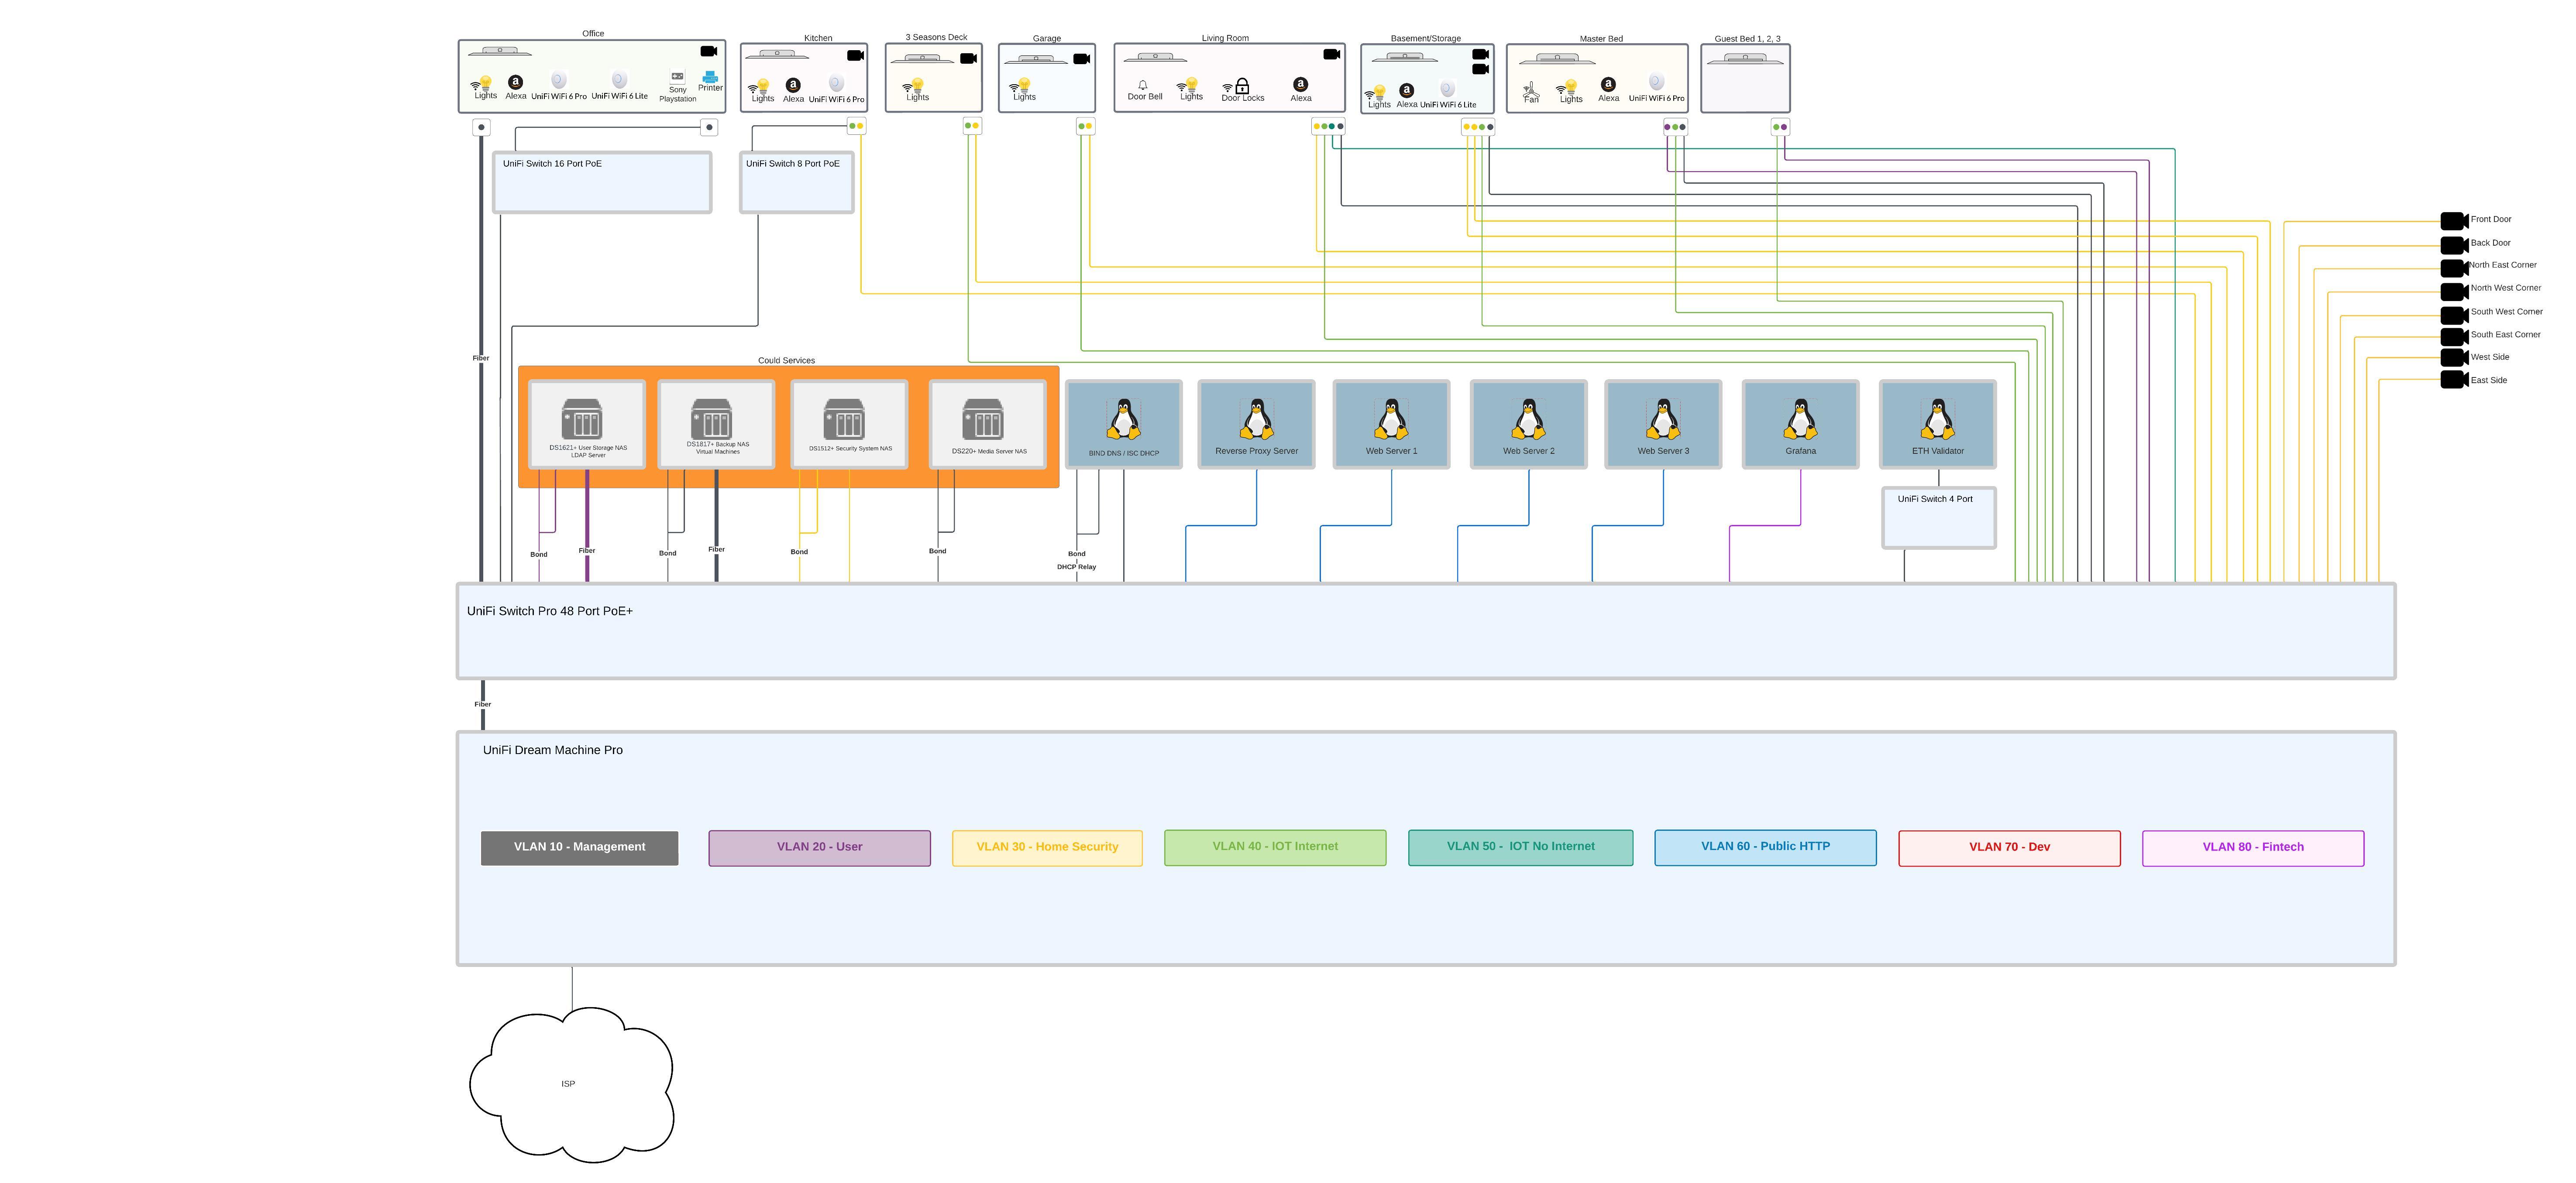
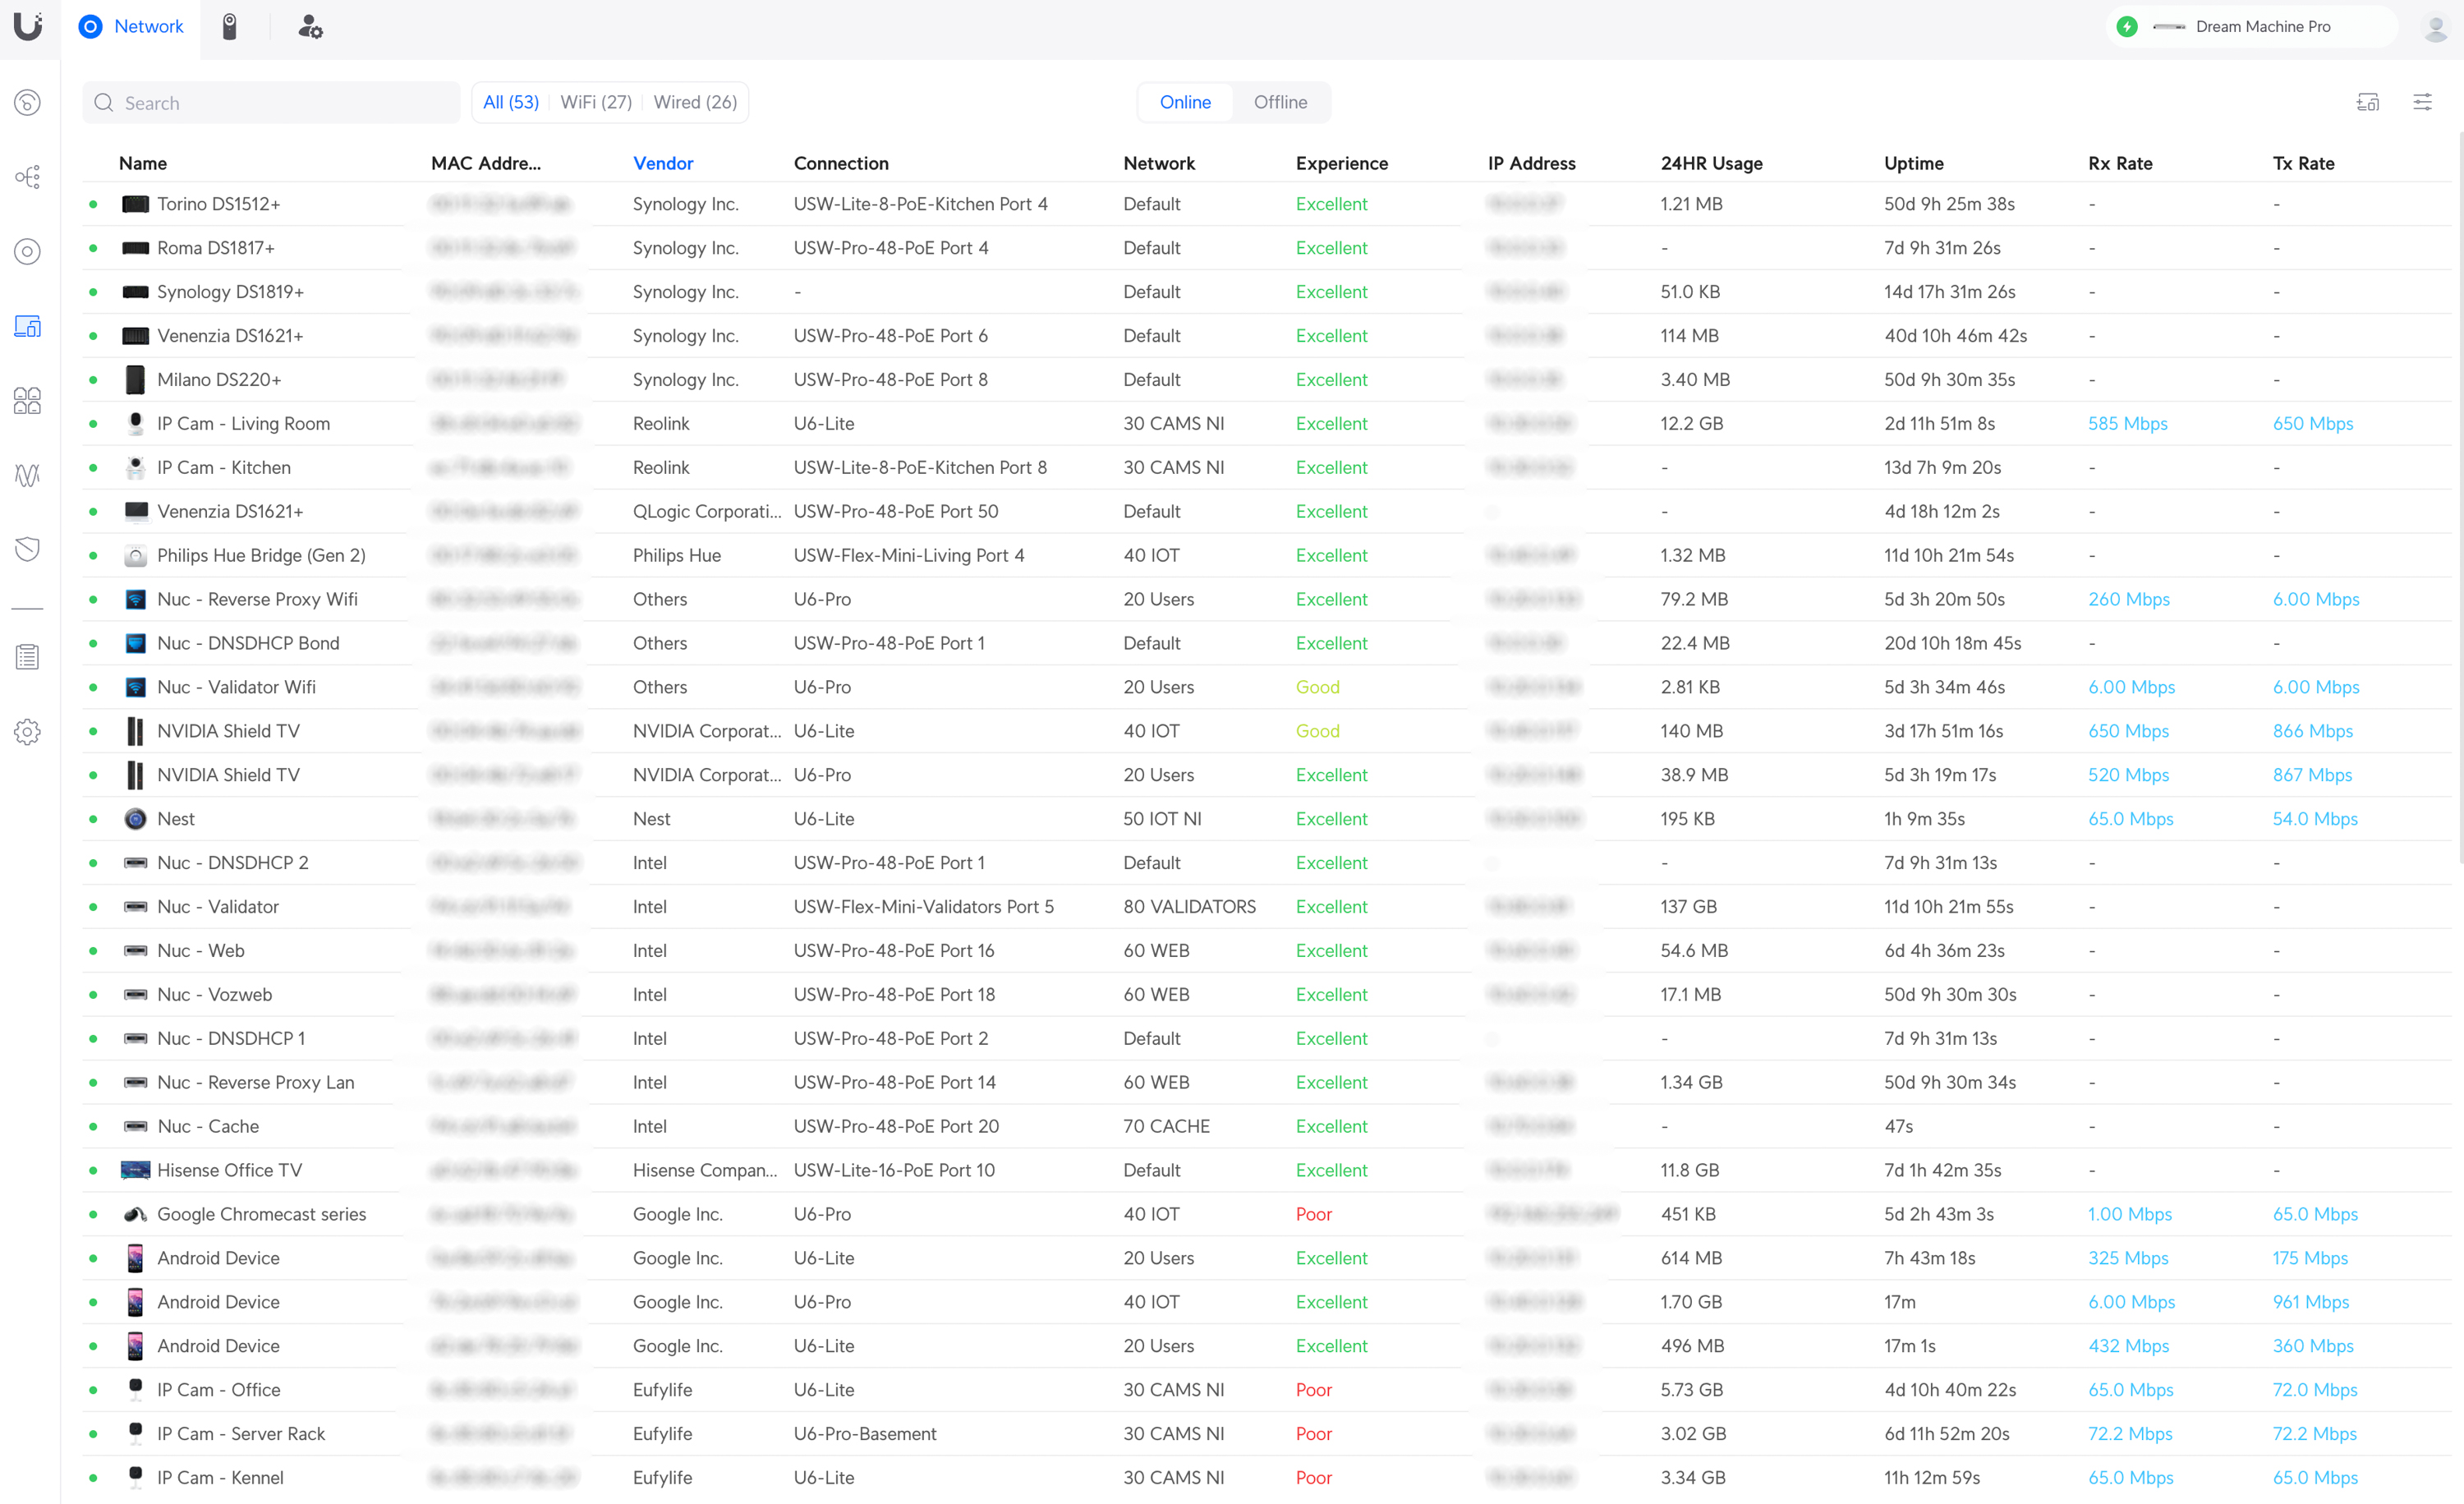
To segregate traffic of IoT devices, users, webservers, and IP cameras, I implemented VLANs on a Ubiquiti DM pro router, adopting a hub-and-spoke topology to a 48 port POE layer 2 switch for efficient connectivity. Additionally, I integrated a Nginx reverse proxy server for traffic management to multiple web servers and other web enabled services. I always enjoyed having direct control over the config files of DNS and DHCP so I implemented BIND and ISC DHCP on a dedicated Ubuntu server and enabled DHCP relay on the router to broadcast DHCP traffic. This allows me to easily build custom dns and dhcp management tools.
For speed, I linked the NAS servers to the switch with fiber and also ran a fiber connection to my office where I have a direct fiber connection to my computer using an SFP+ to USBC connector providing 10Gbps speeds directly to my office computer.
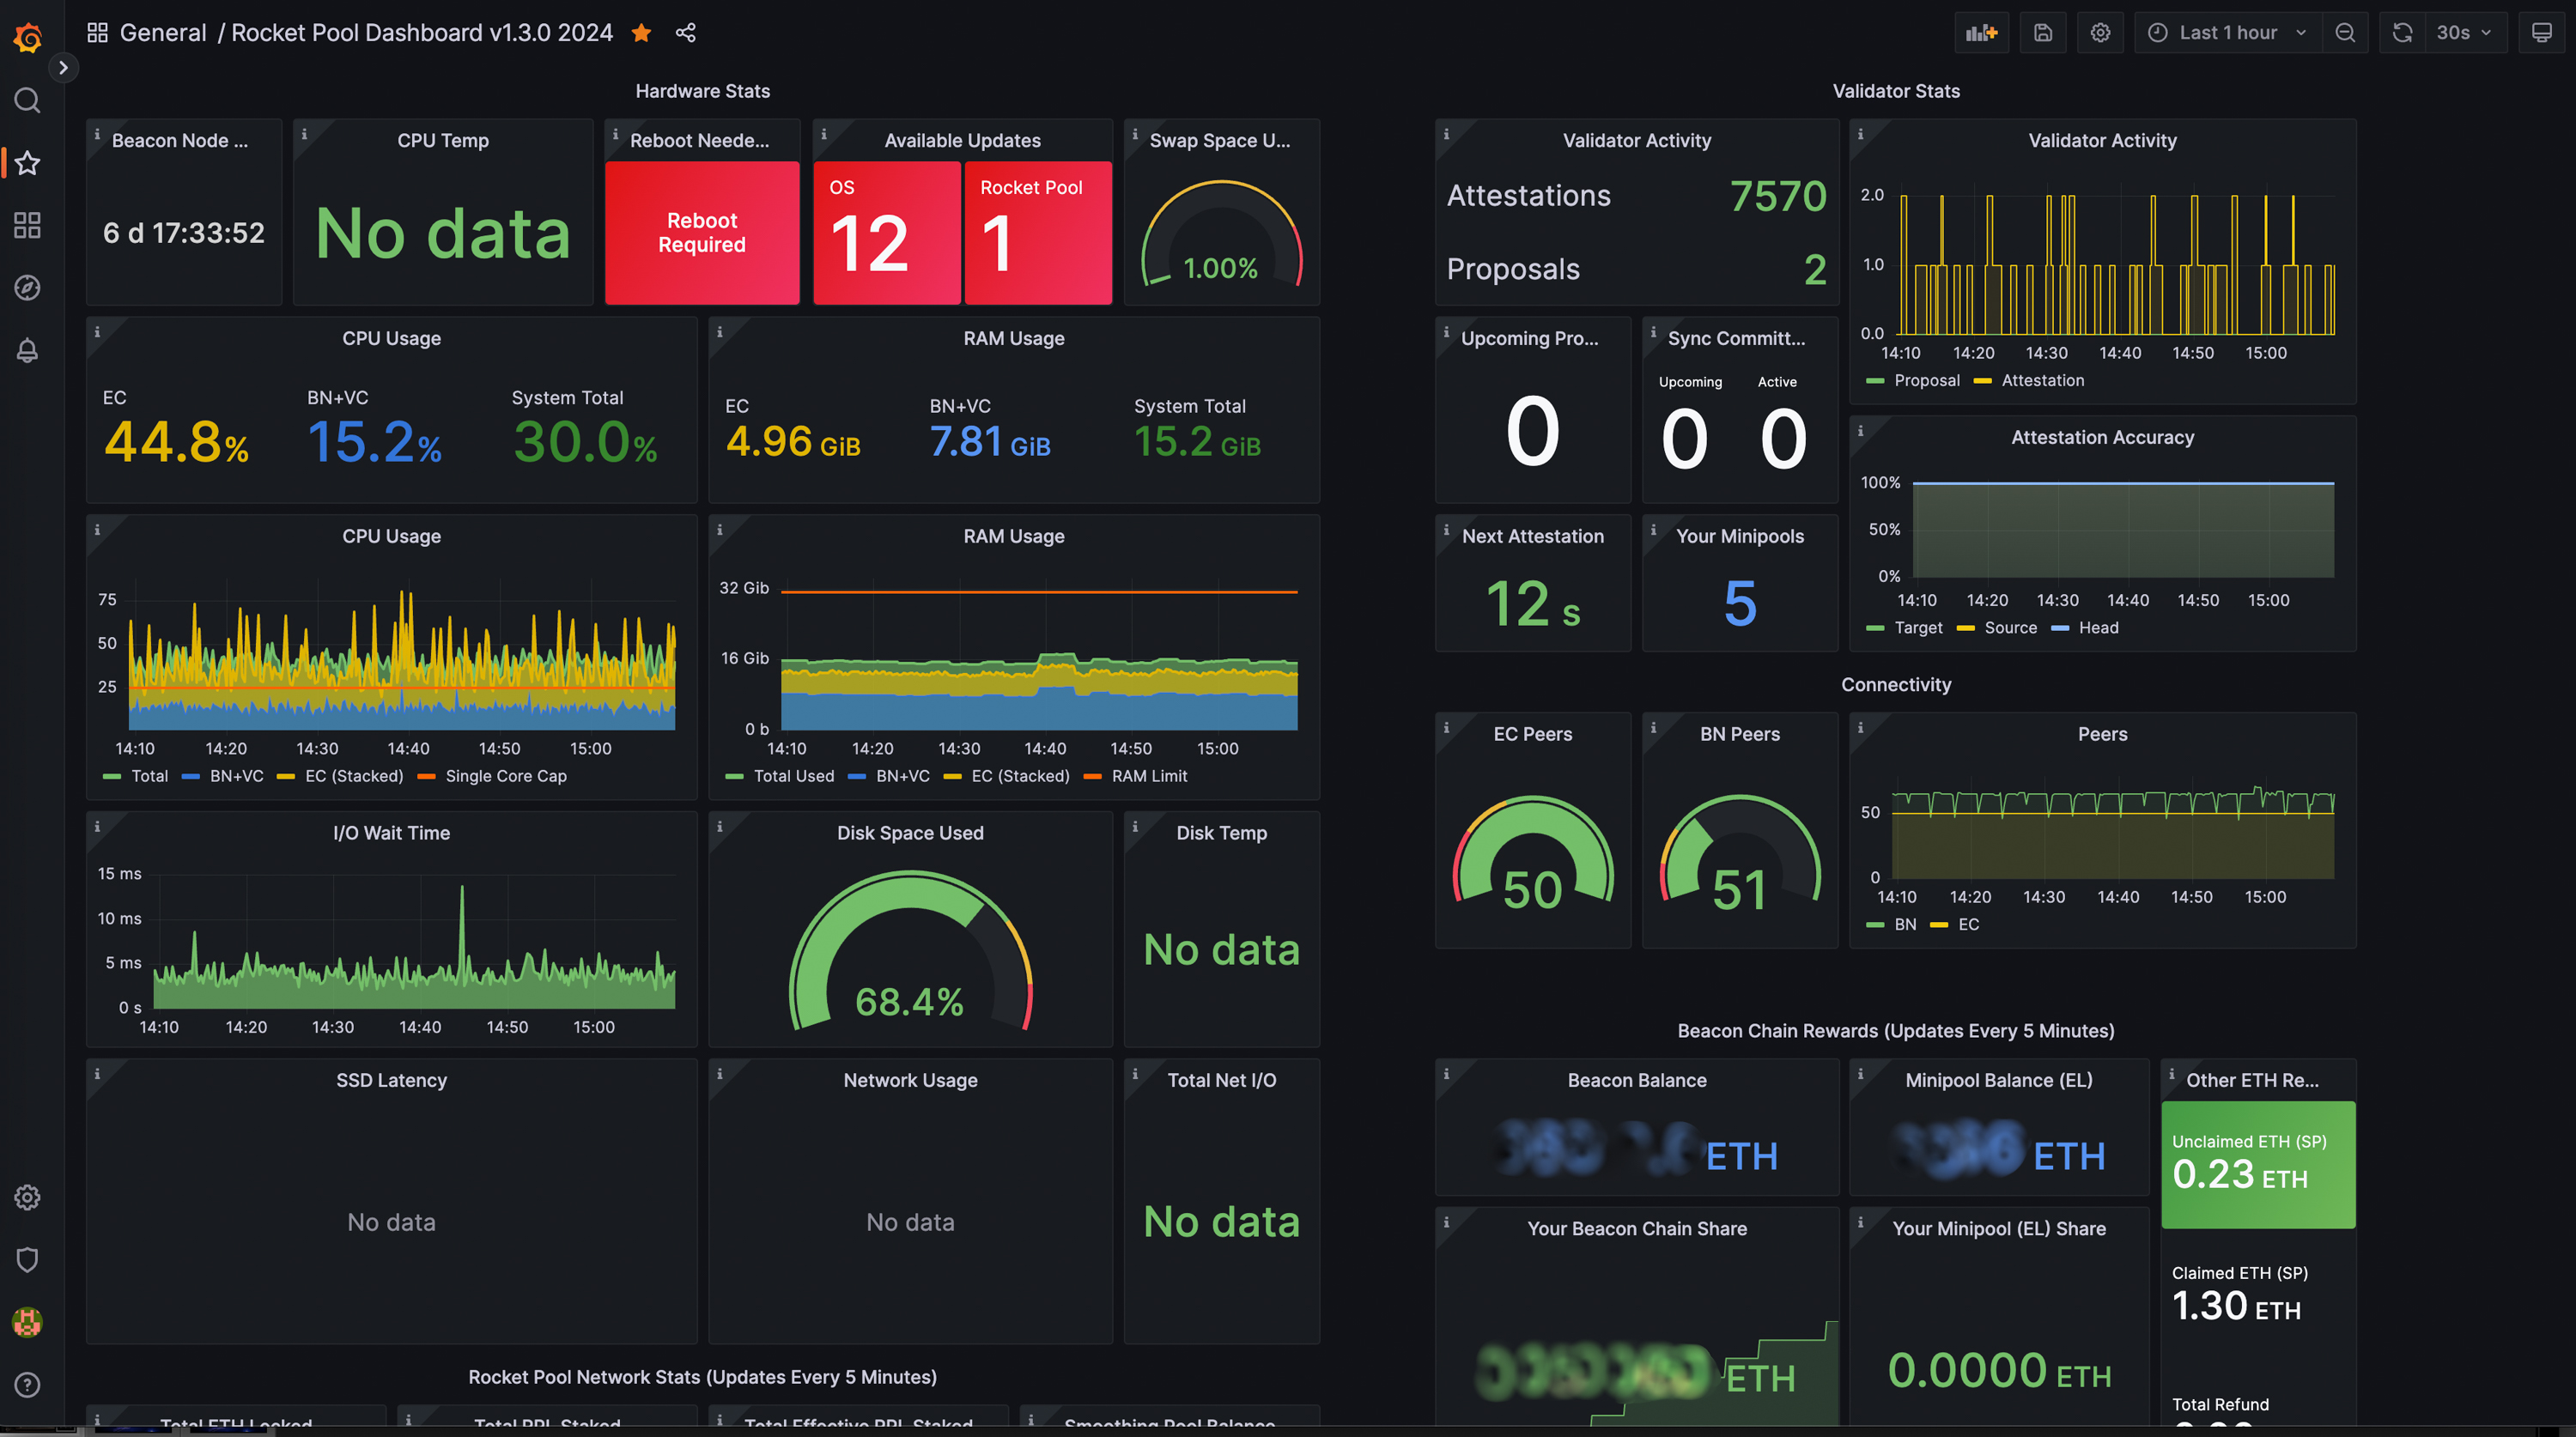
As an advocate of cryptocurrency, I also have dedicated servers running Ethereum validators with Rocketpool, Docker which use Prometheus, and Grafana for monitoring.
This comprehensive implementation not only allowed me to create a personal cloud without added costs but also enhanced security and control.
Network Diagram
This basic network diagram, created using Miro, represents the physical layer meeting the logical layer which gives me a nice overview and makes it easier to troubleshoot issues and add new features.
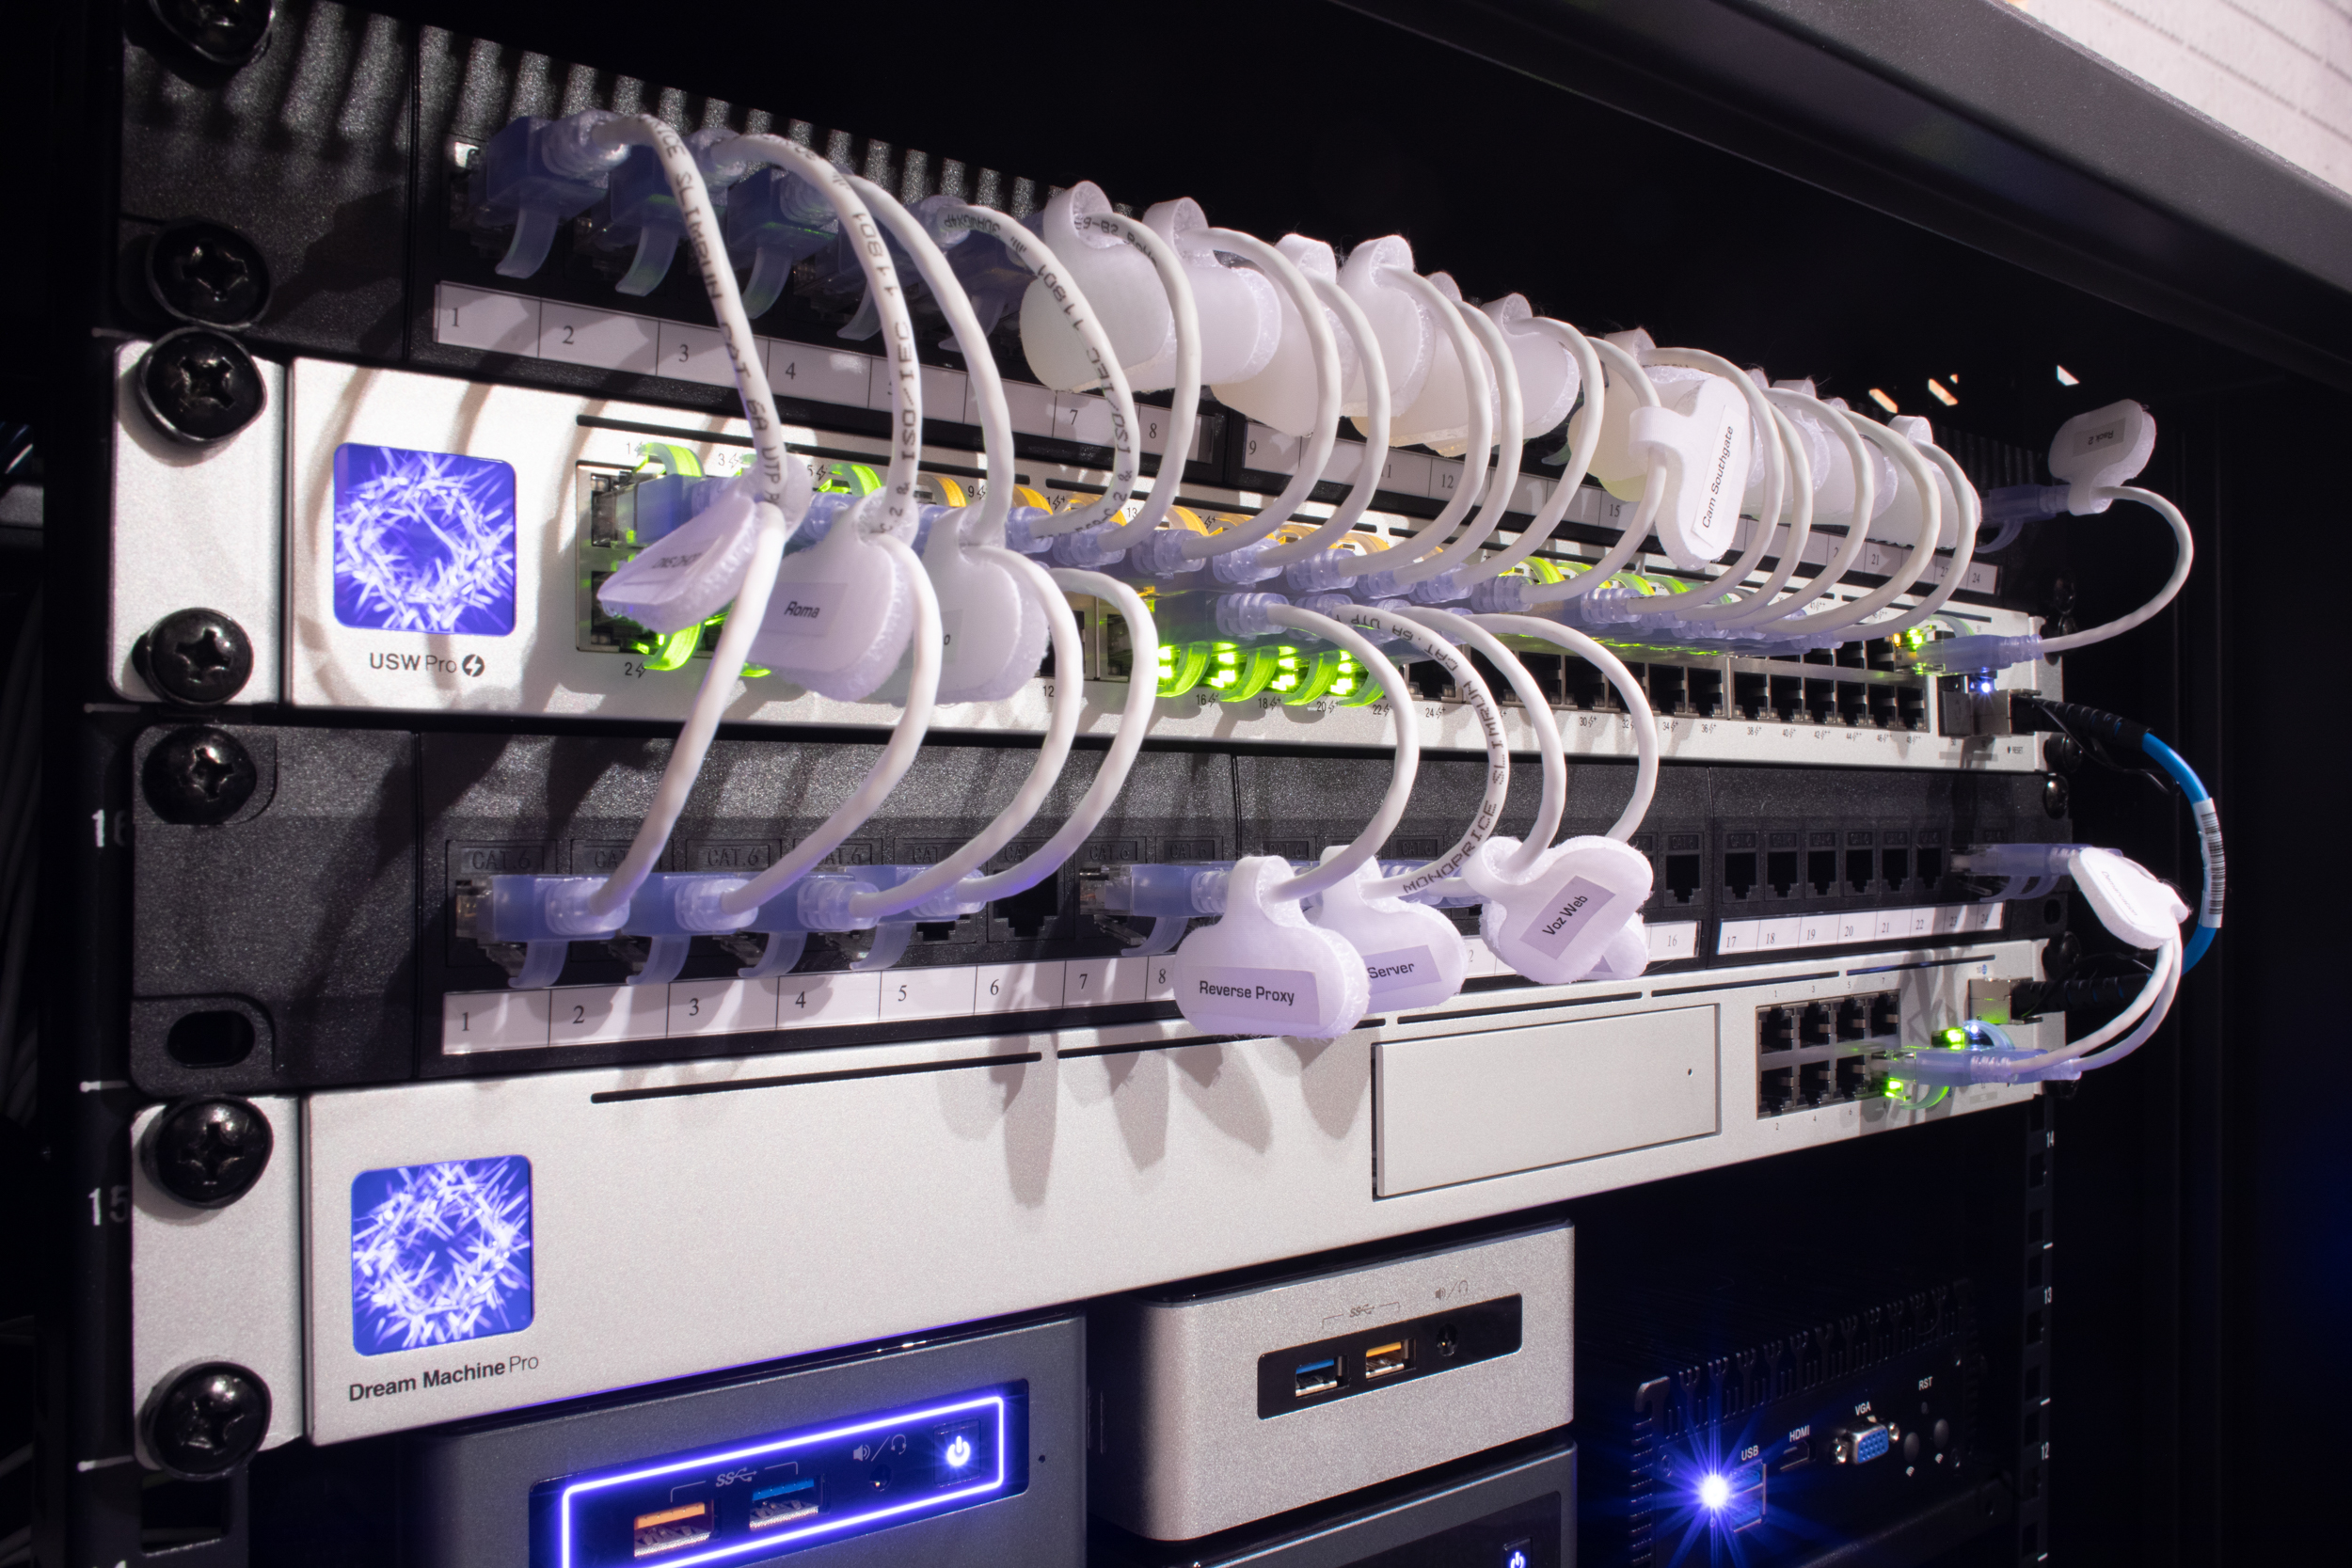
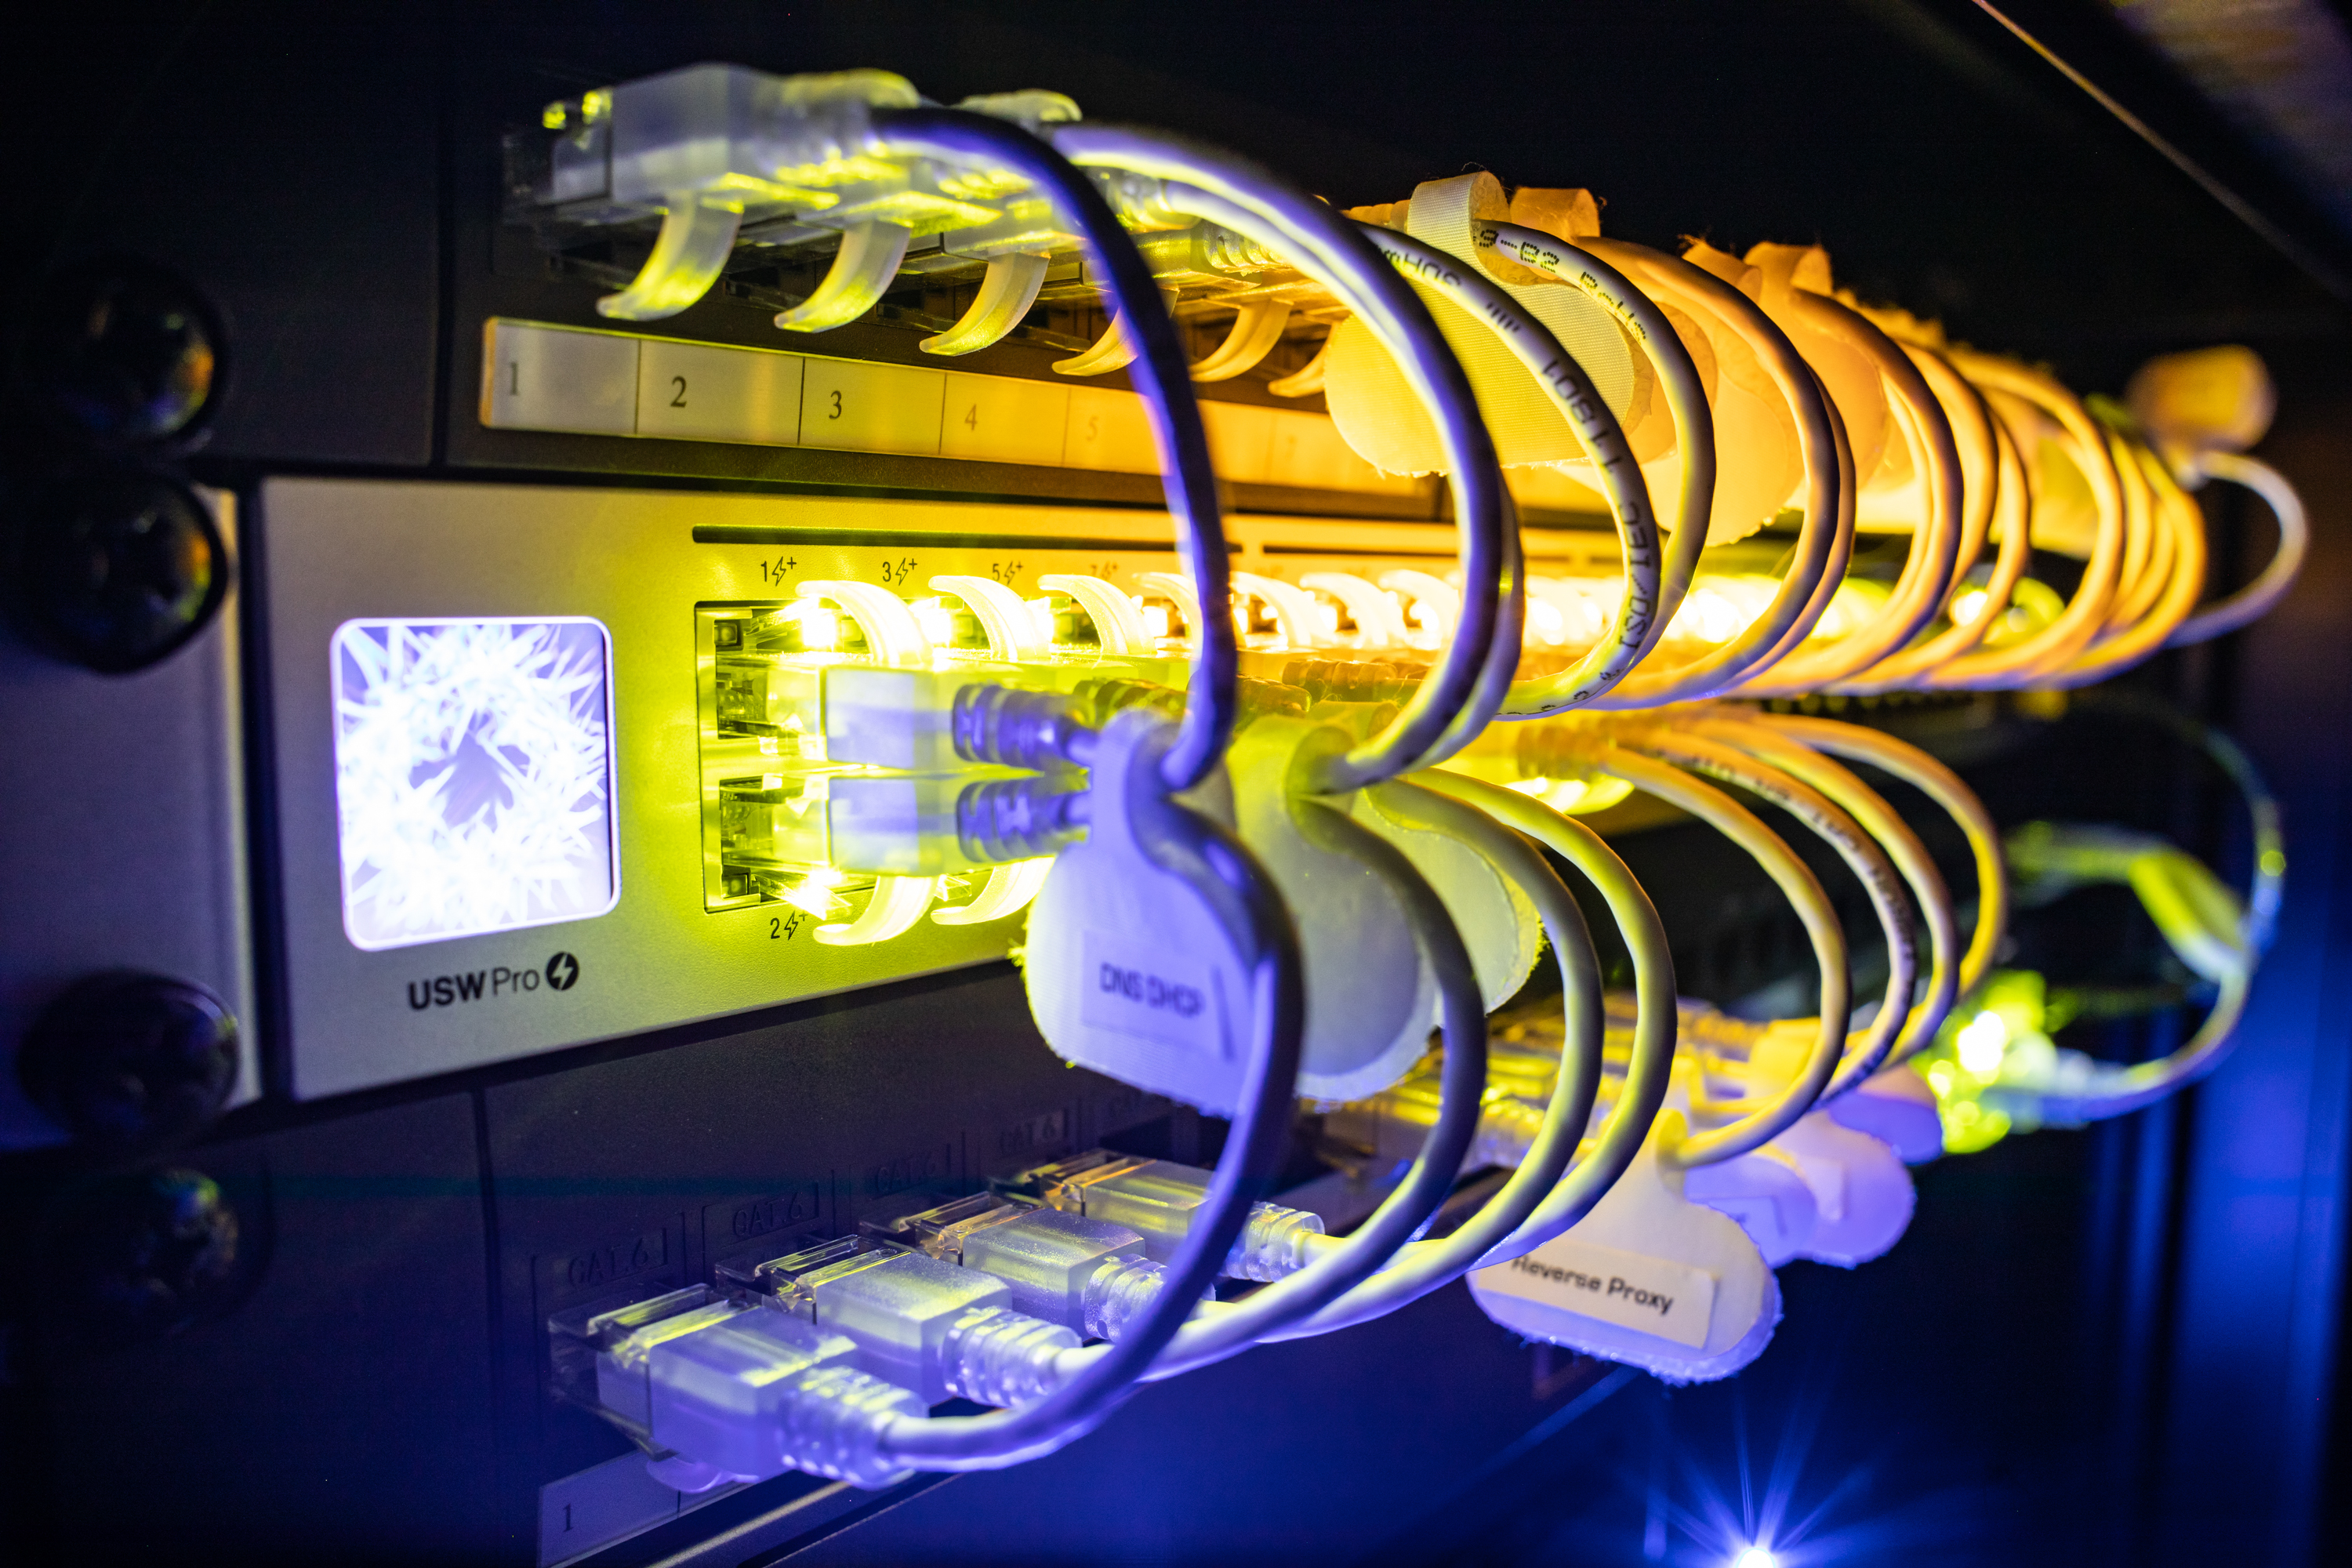
Ubiquiti 48port POS Switch and Ubiquiti Dream Machine Pro
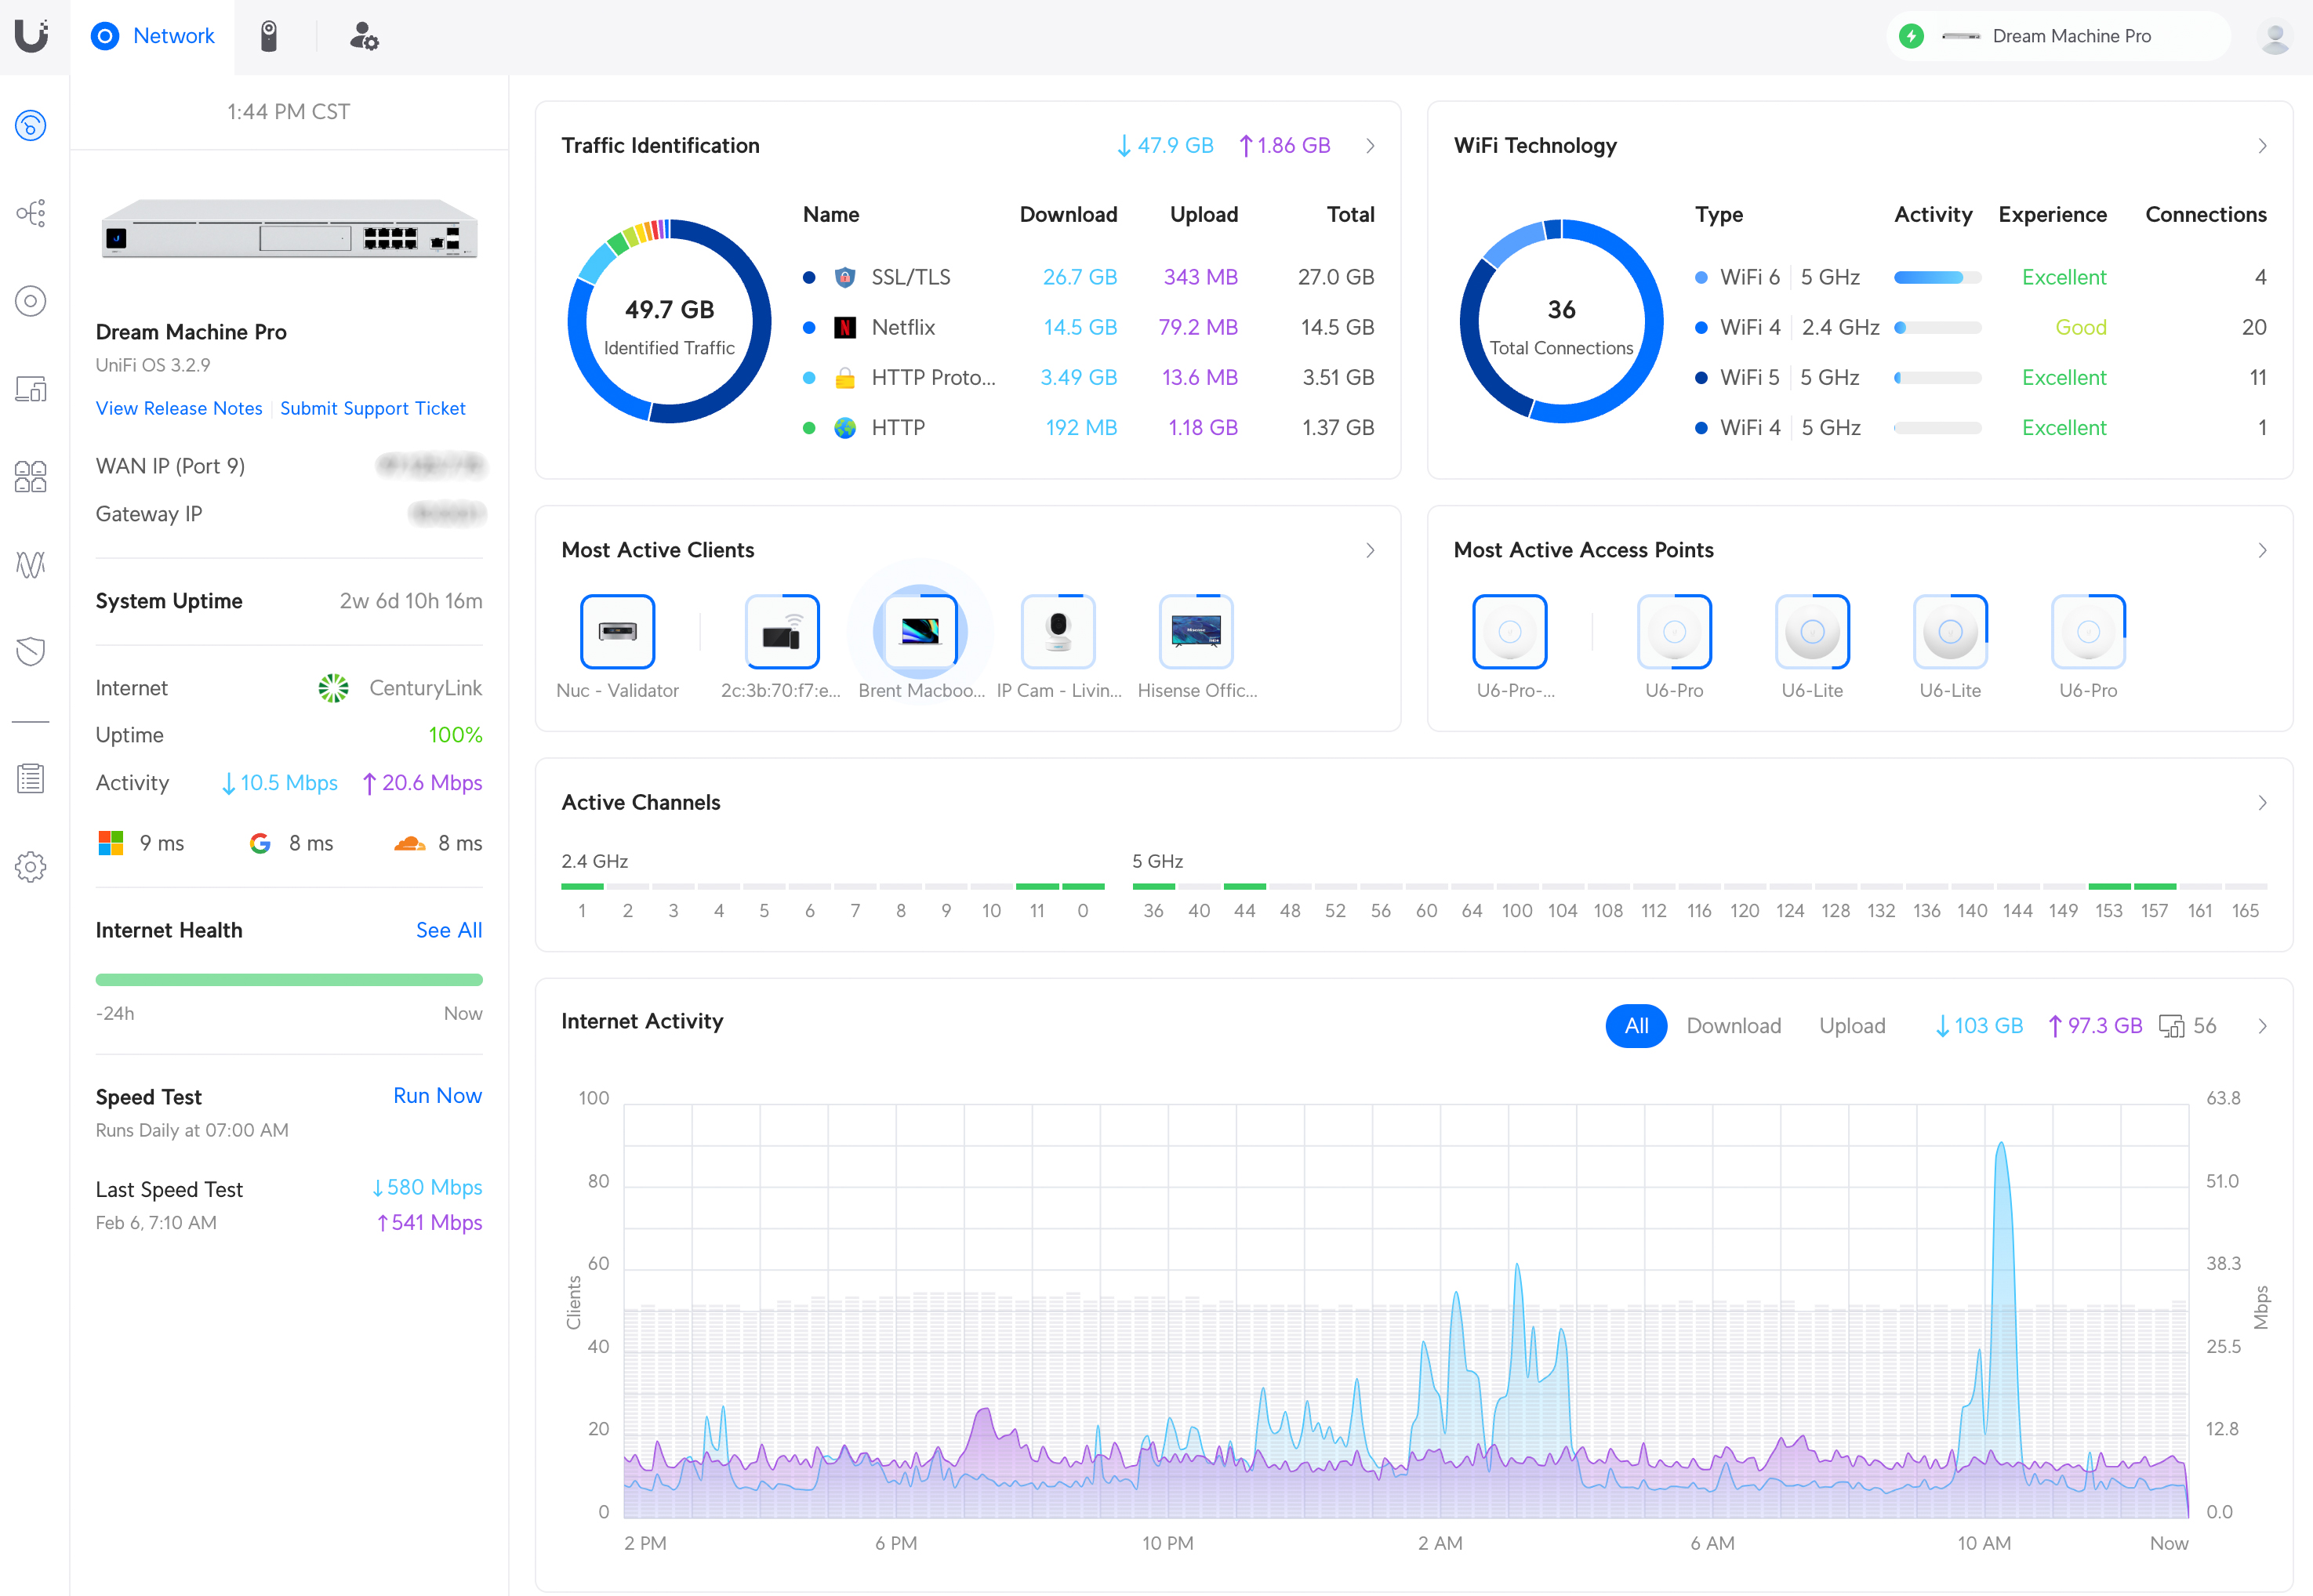
The Ubiquiti Dream Machine Pro has more than enough features for a medium size business having a tateless firewall, VLAN capabilities, advanced routing, and a built in controller for access points and so much more. The 48port POE+ layer 2 switch allows me to control traffic with VLANs and broadcast DHCP traffic with DHCP relay. I was very strict with cable managment and labeling cables with velcro tags.
AI and GPU Server
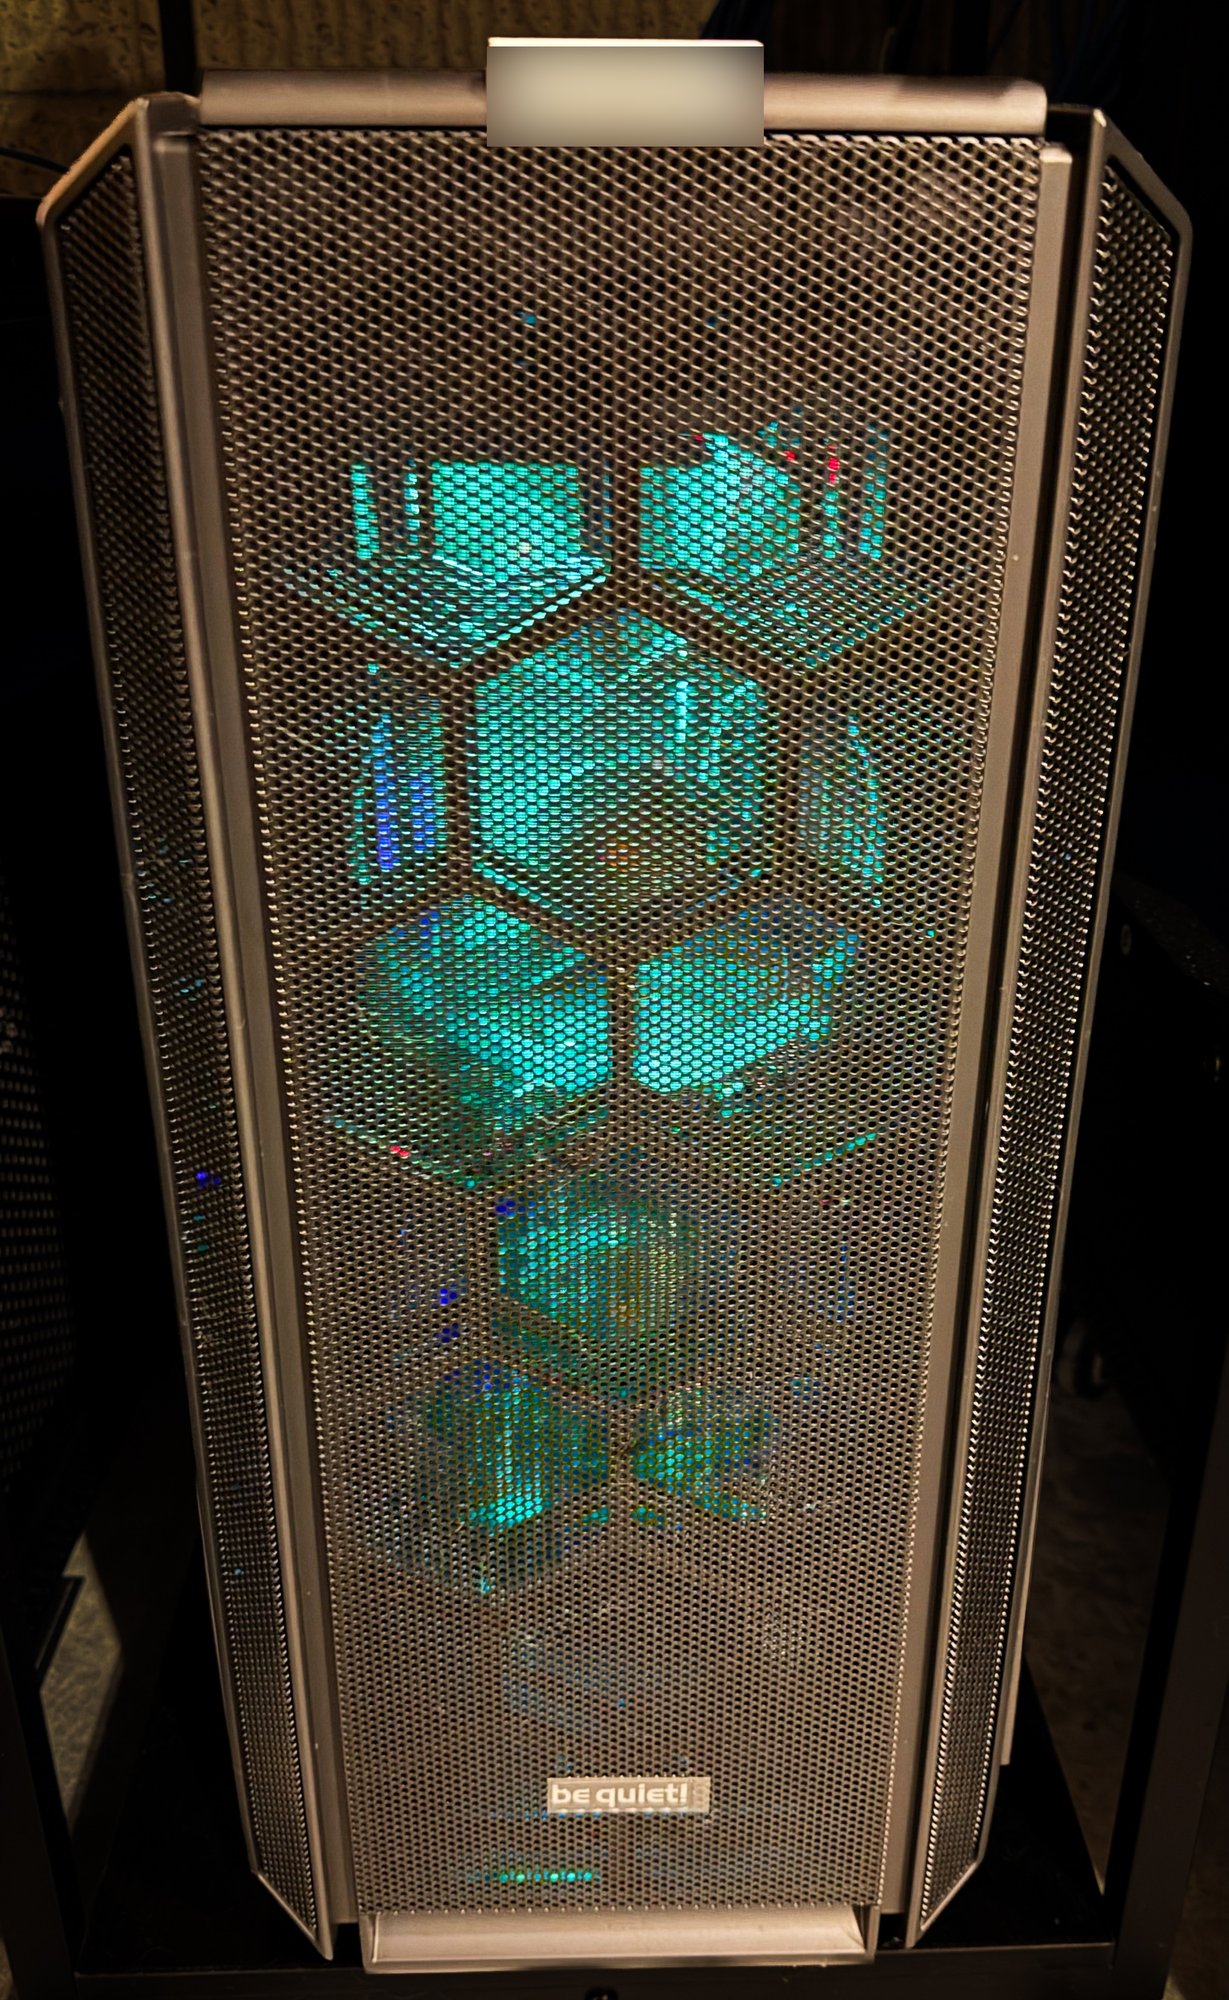
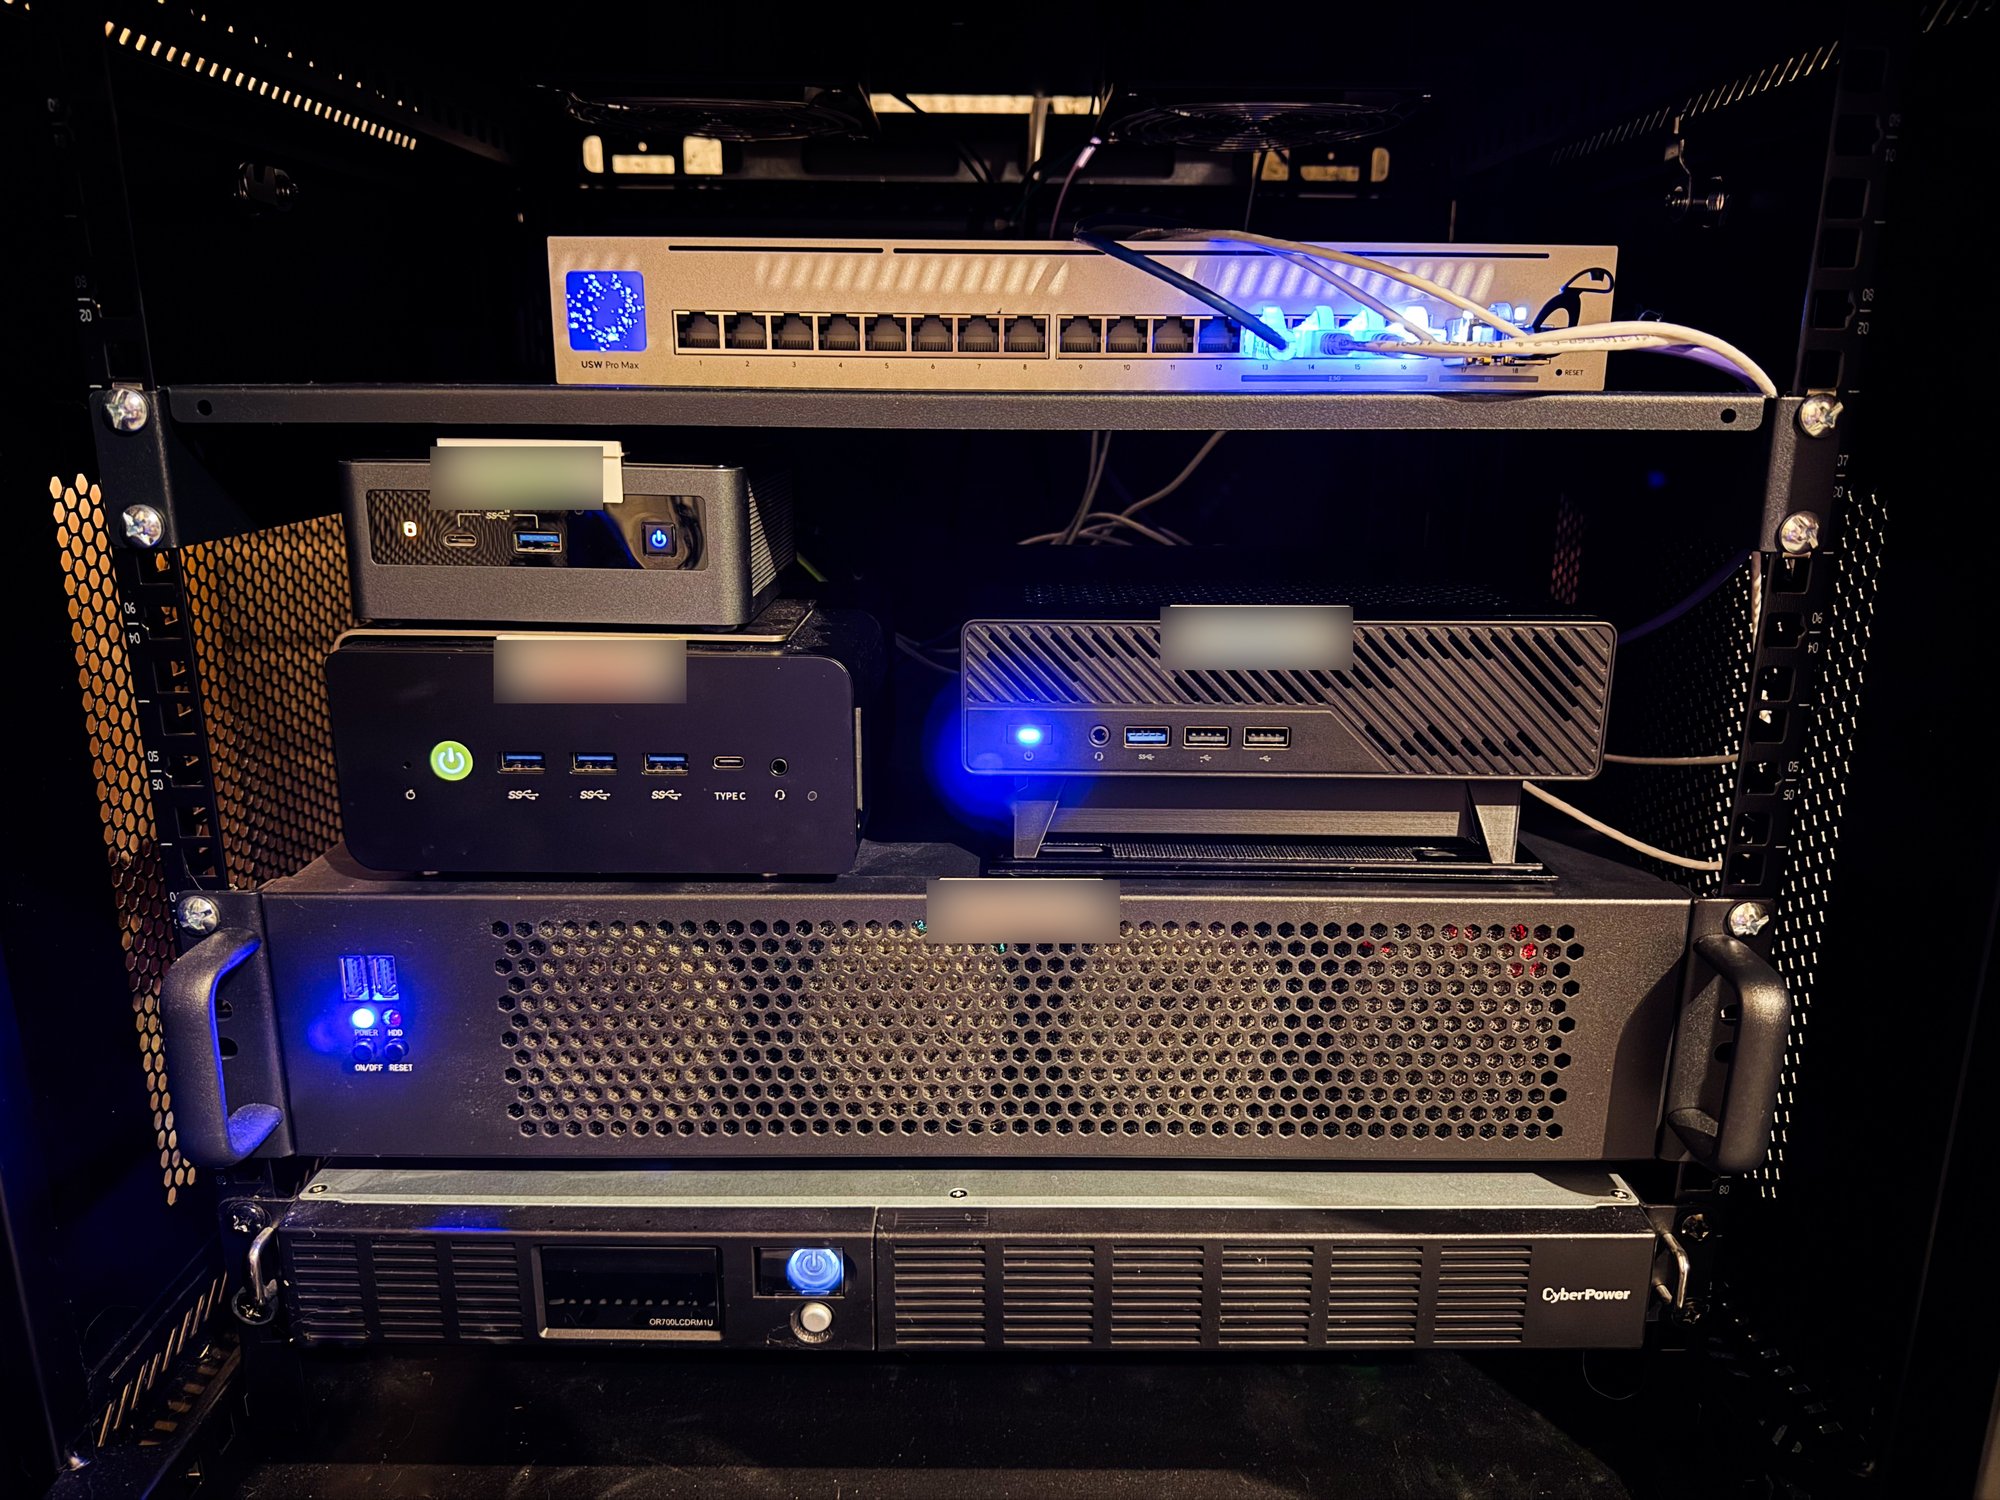
The AI box is a Ryzen 9 7900X with 64 GB of RAM, an RTX 5090 with 32 GB of VRAM, and a 4 TB NVMe drive for models and data. It runs local language models through Ollama and is the backend for the AI features in Zepey and Perfect Home Strategies, and it also handles the voice commands that come in through Home Assistant. It is also what answers you in the AI assistant chatbox on this page, so go ahead and ask it something. Nothing leaves the house unless I want it to.
Home Assistant
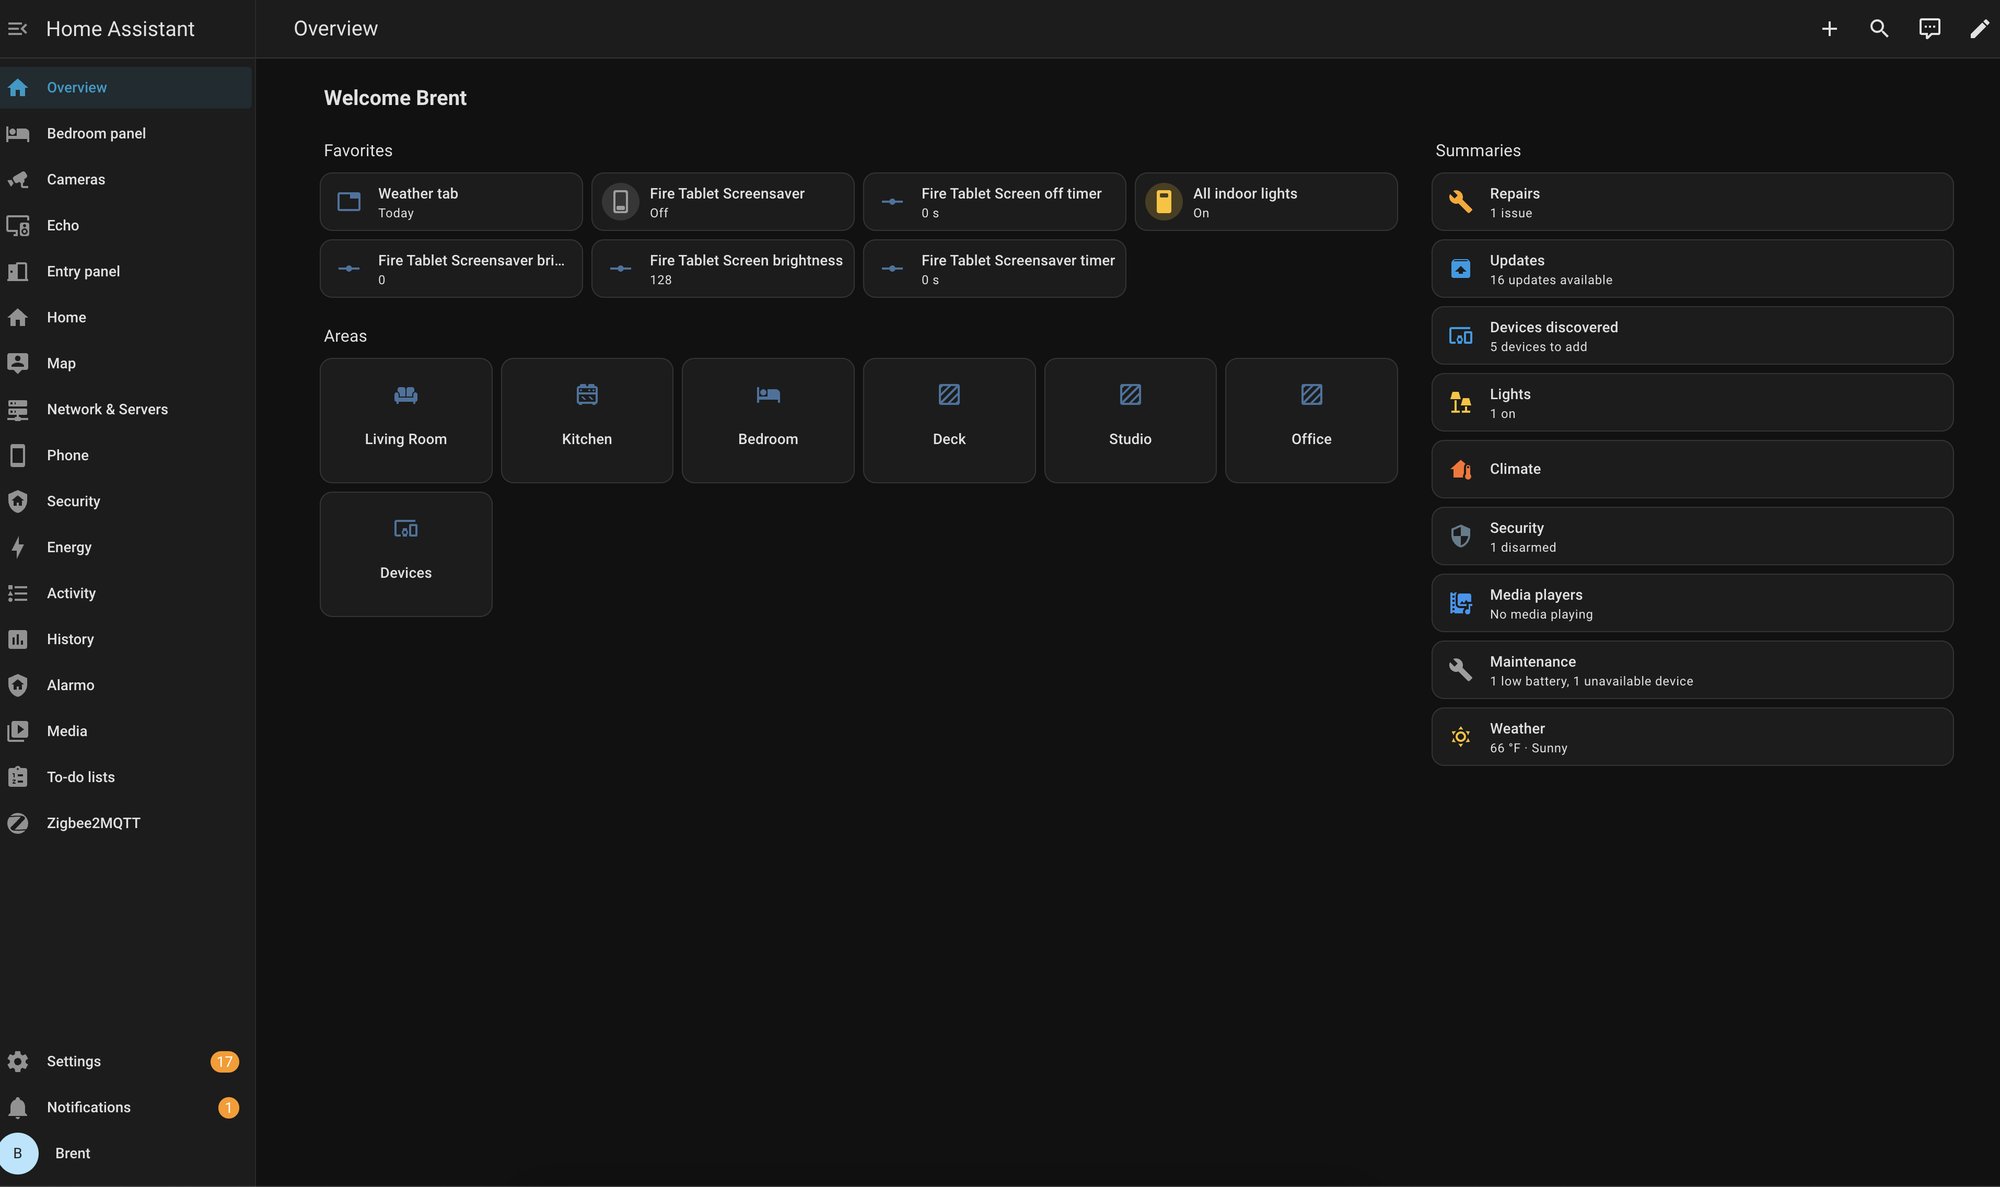
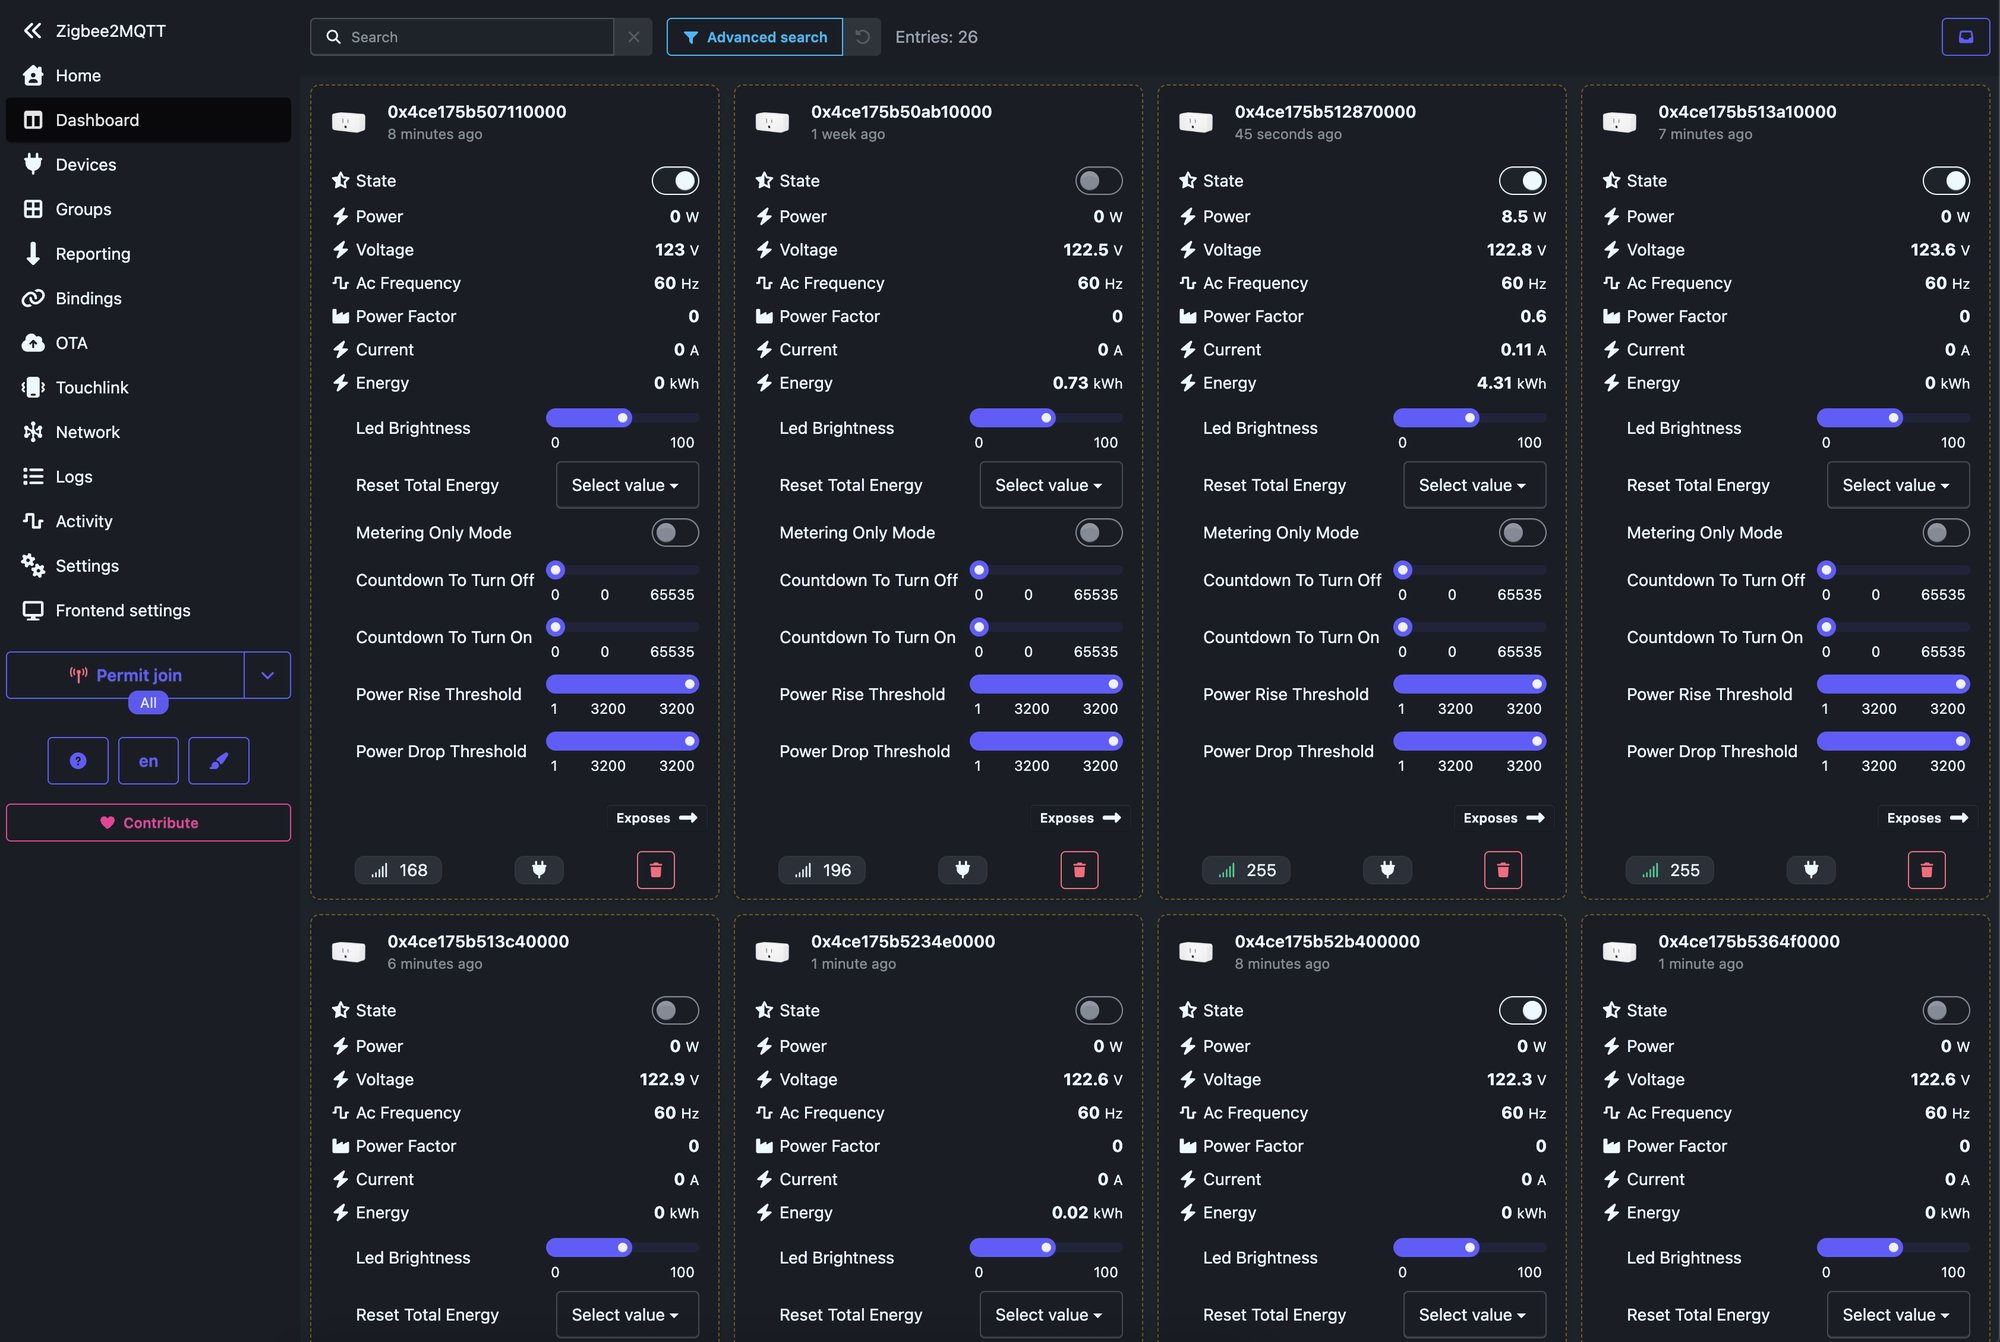
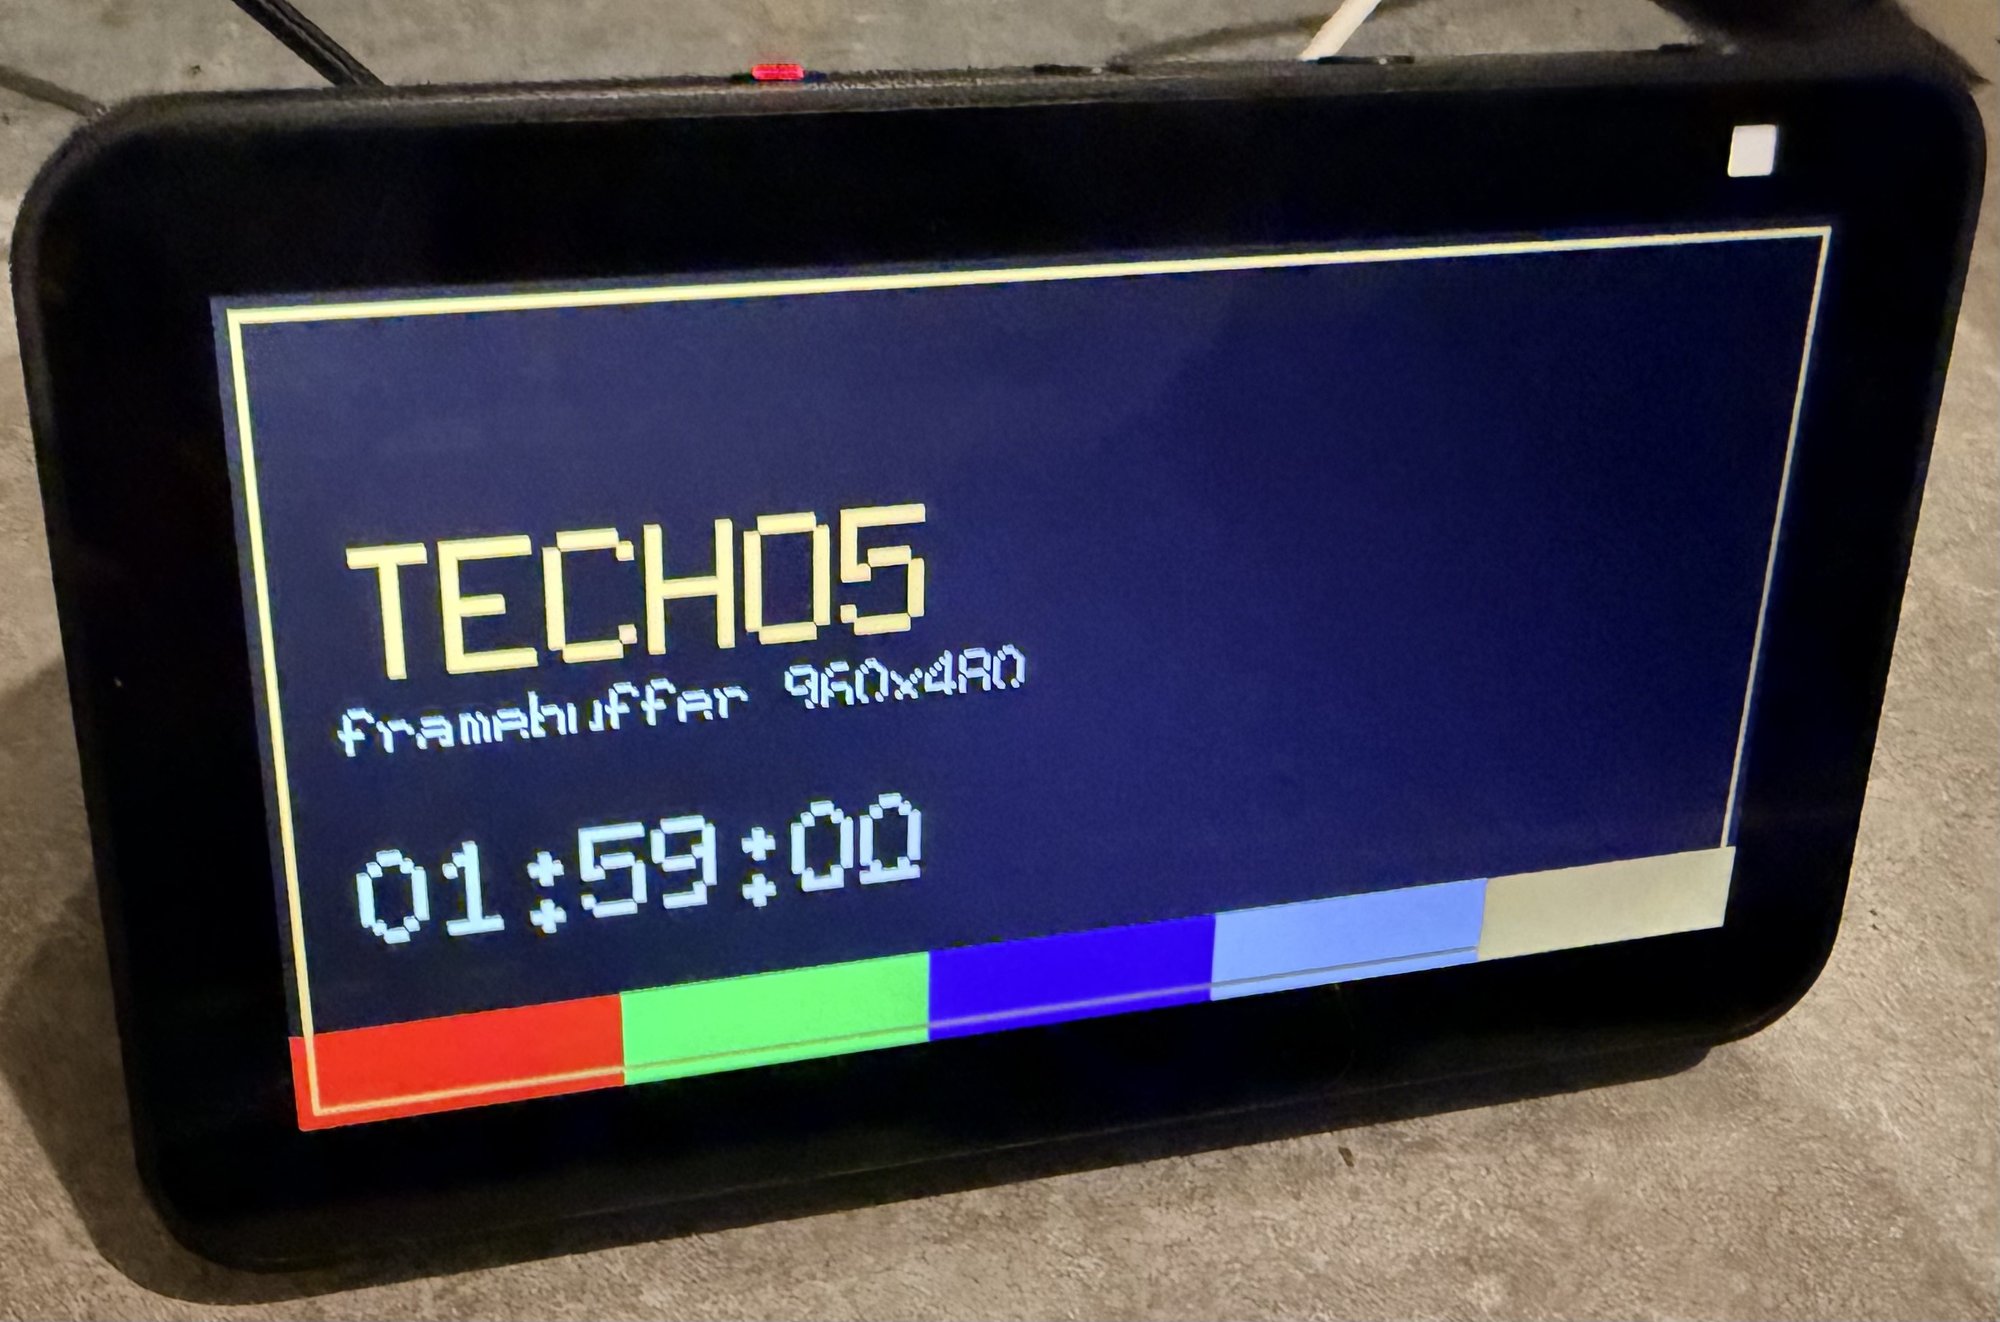
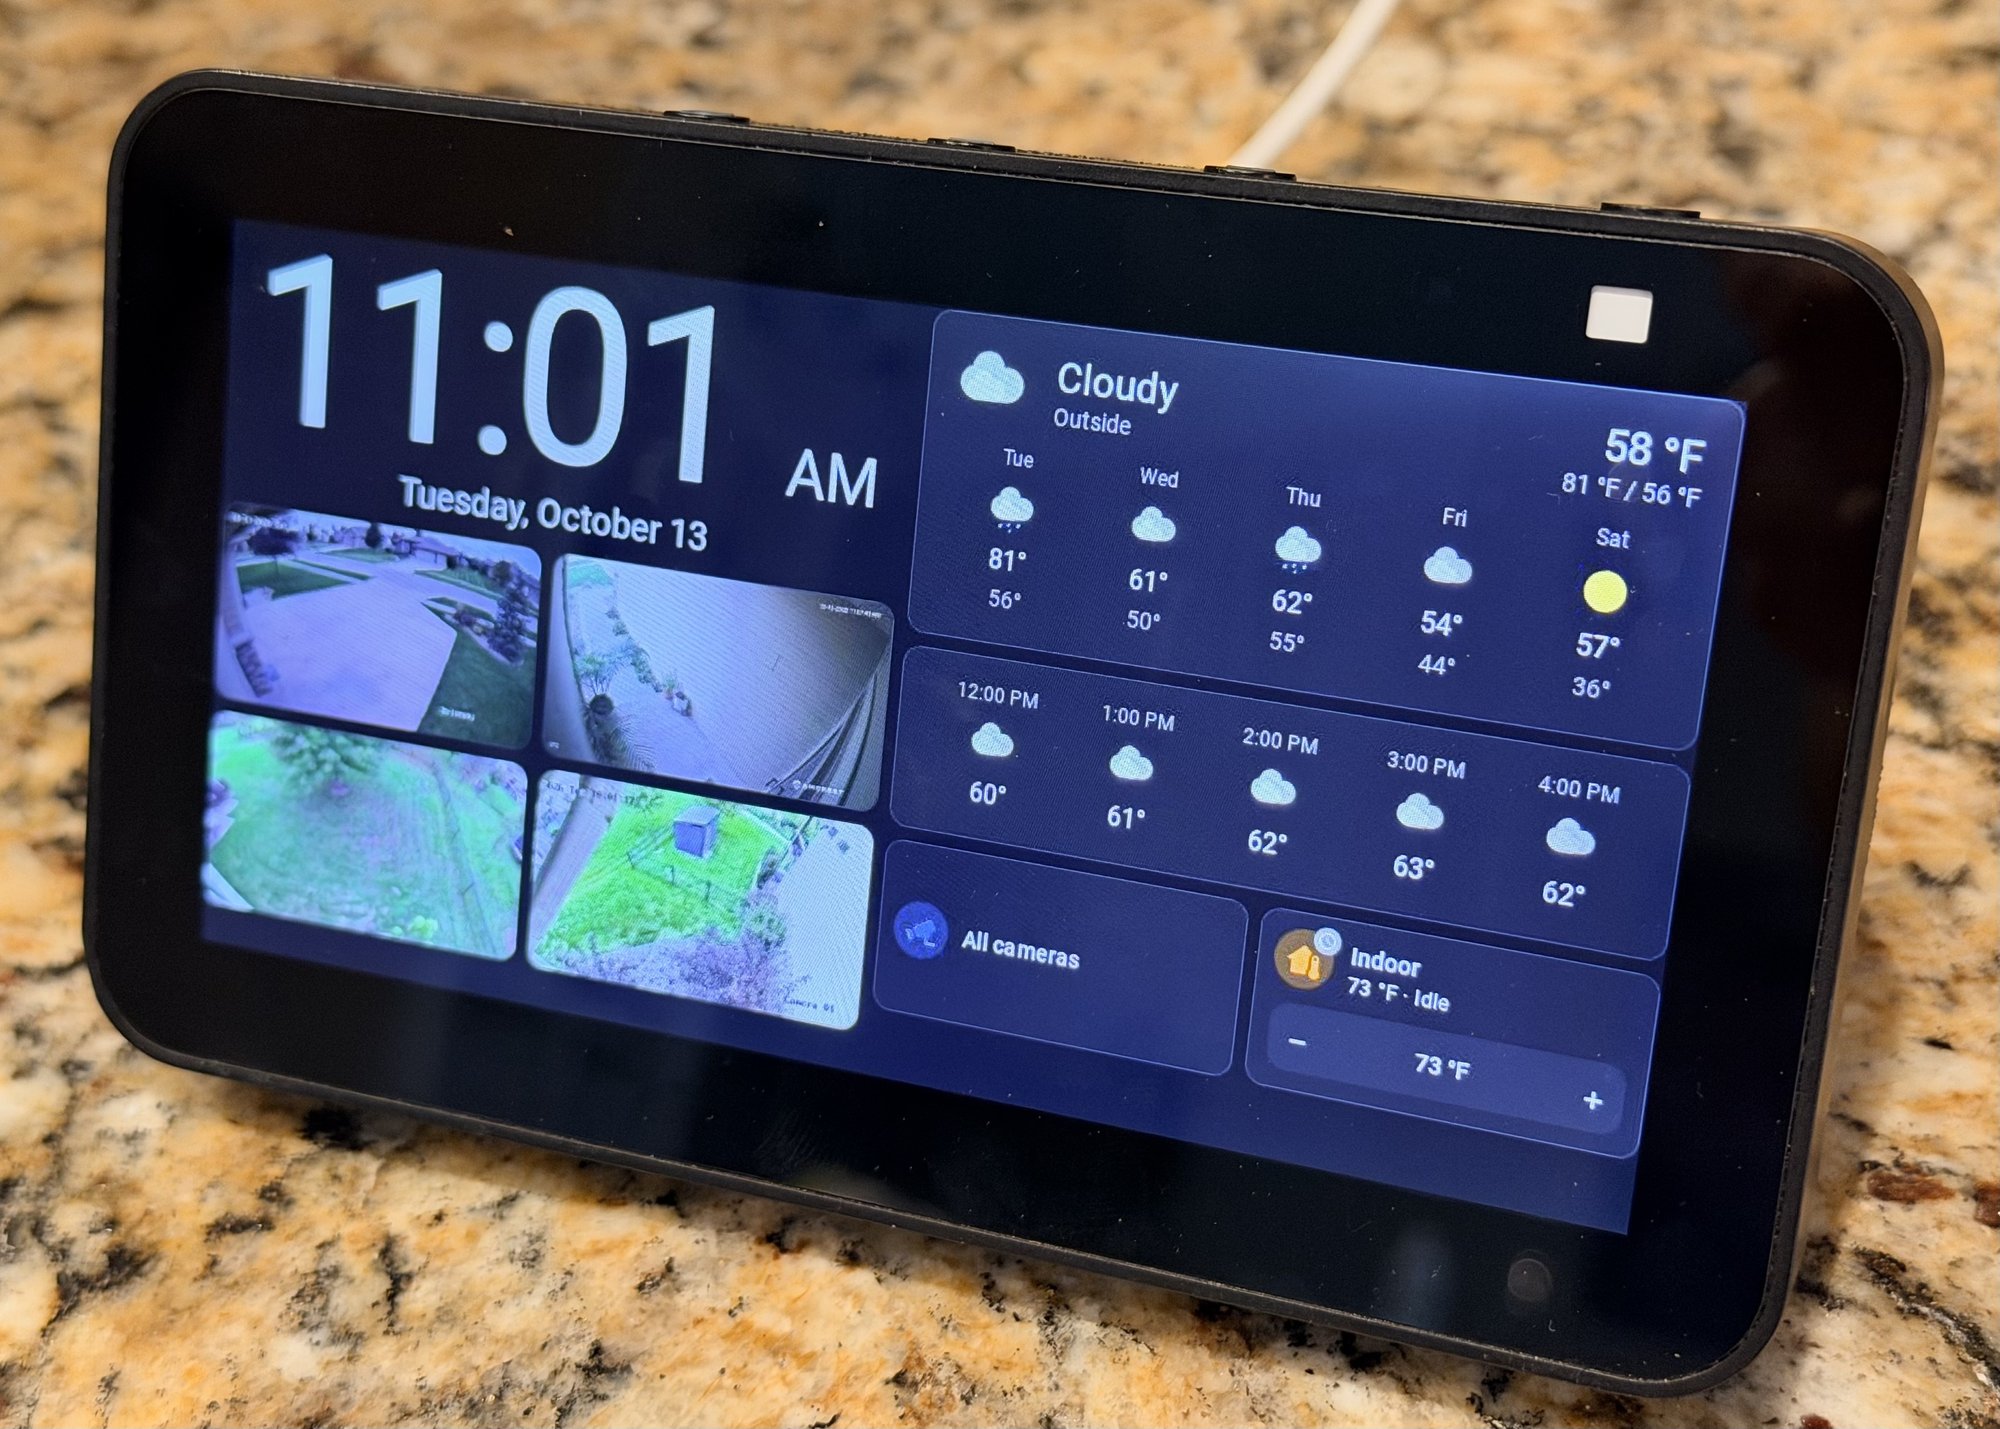
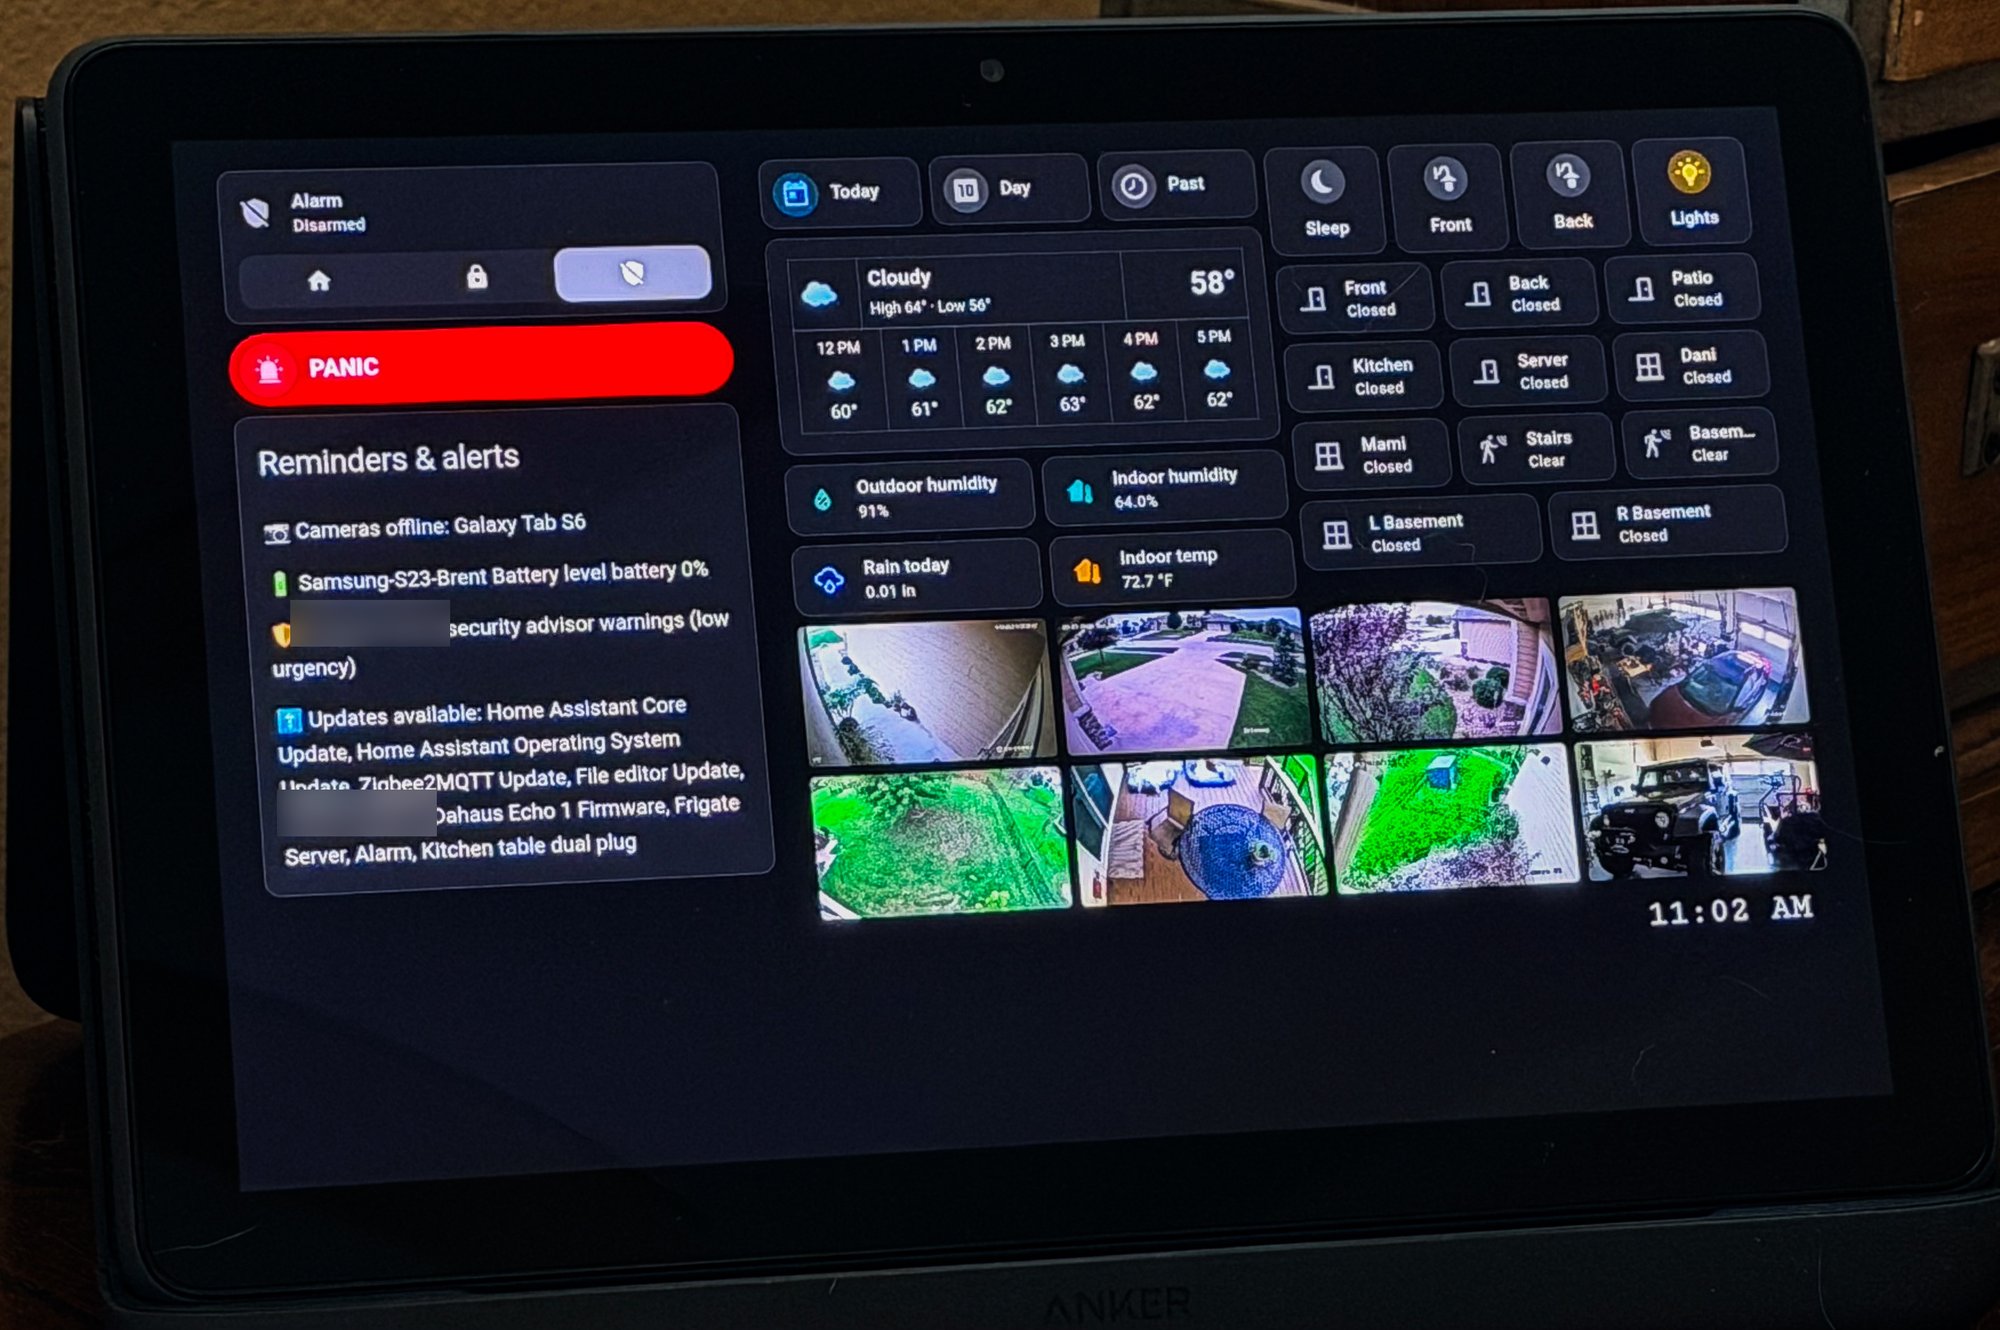
Home Assistant runs as a VM and ties the cameras, alarm, lights, thermostat, and sensors together. The Zigbee side goes through Zigbee2MQTT with a PoE coordinator on the network, which gives me metered smart plugs, door and window sensors, and switches without any cloud account in the loop. The small screen is an Echo Show 5 that I unlocked and flashed with LineageOS so it runs as a Home Assistant voice satellite and dashboard. The larger one is an Anker tablet in a printed wall mount that shows the cameras, the alarm, and the lights.
Rocketpool Ethereum Validators
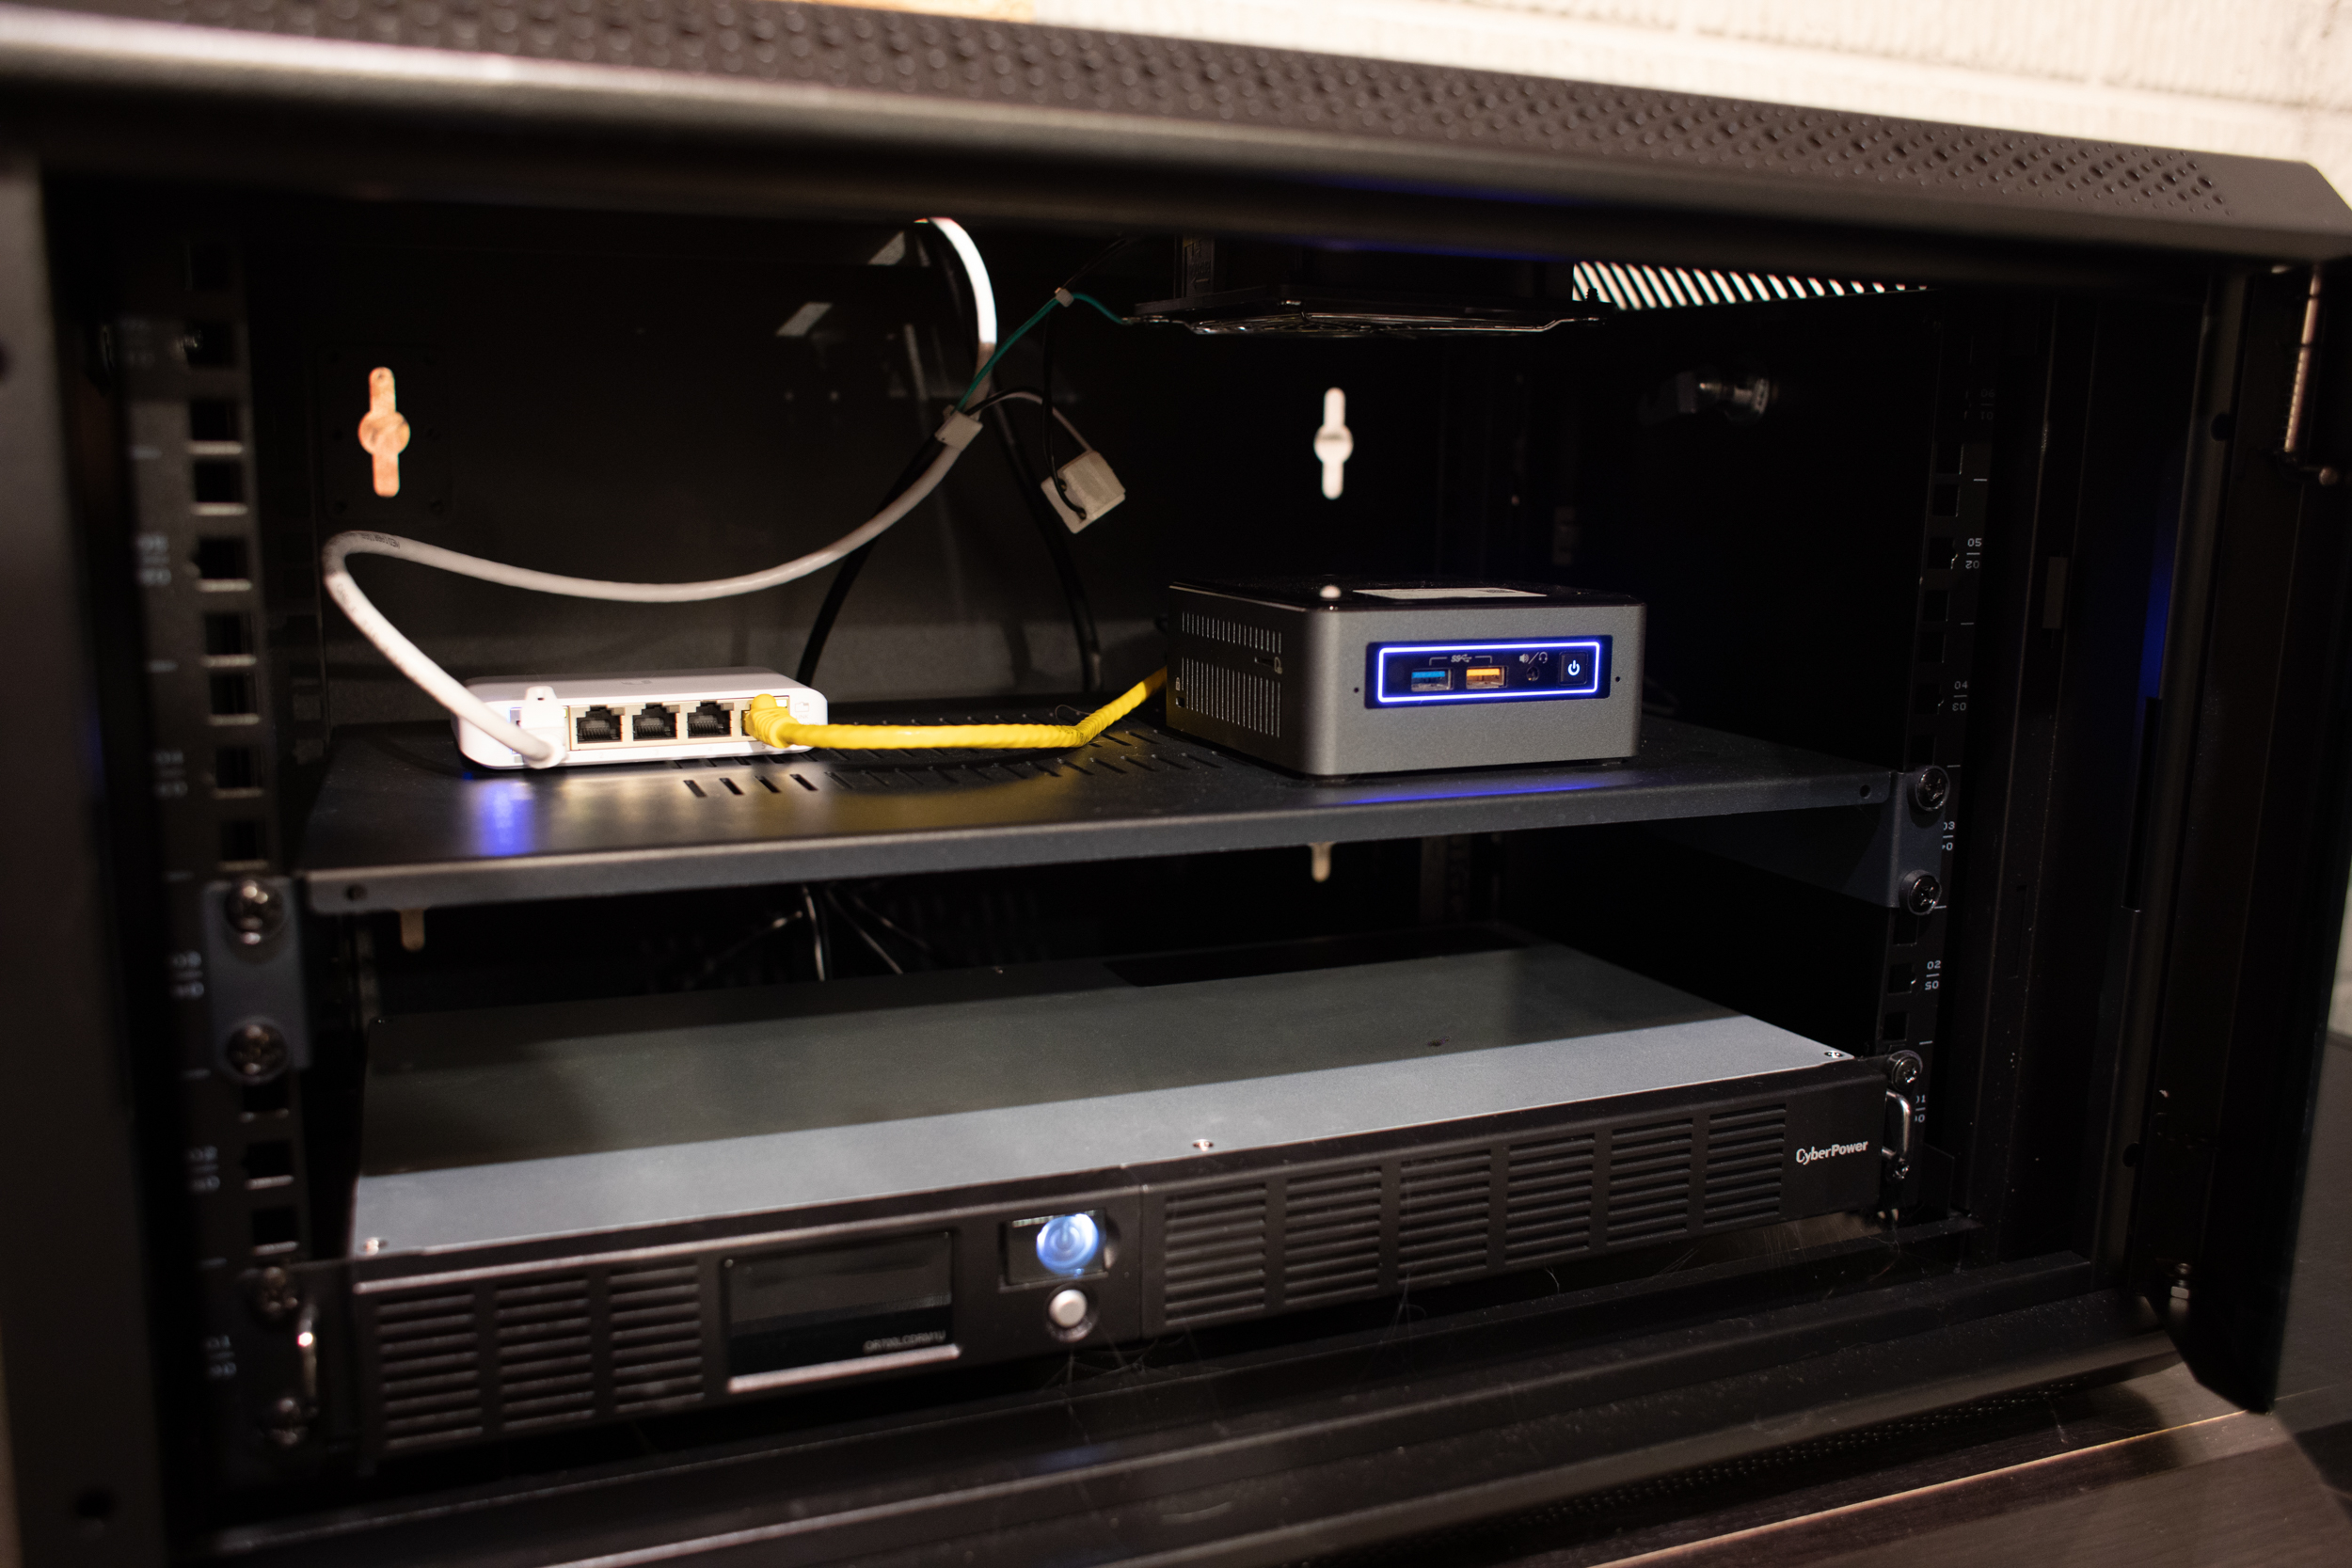
I have two dedicated servers running Rocketpool Ethereum validators. I use Docker to run the Rocketpool software, Geth nodes, and Prometheus and Grafana to monitor the servers. I wanted a seperate rack and PDU for the Ethereum validator which runs nicely on an Intel Nuc with Linux.
NavePoint 18U and 9U Server Racks
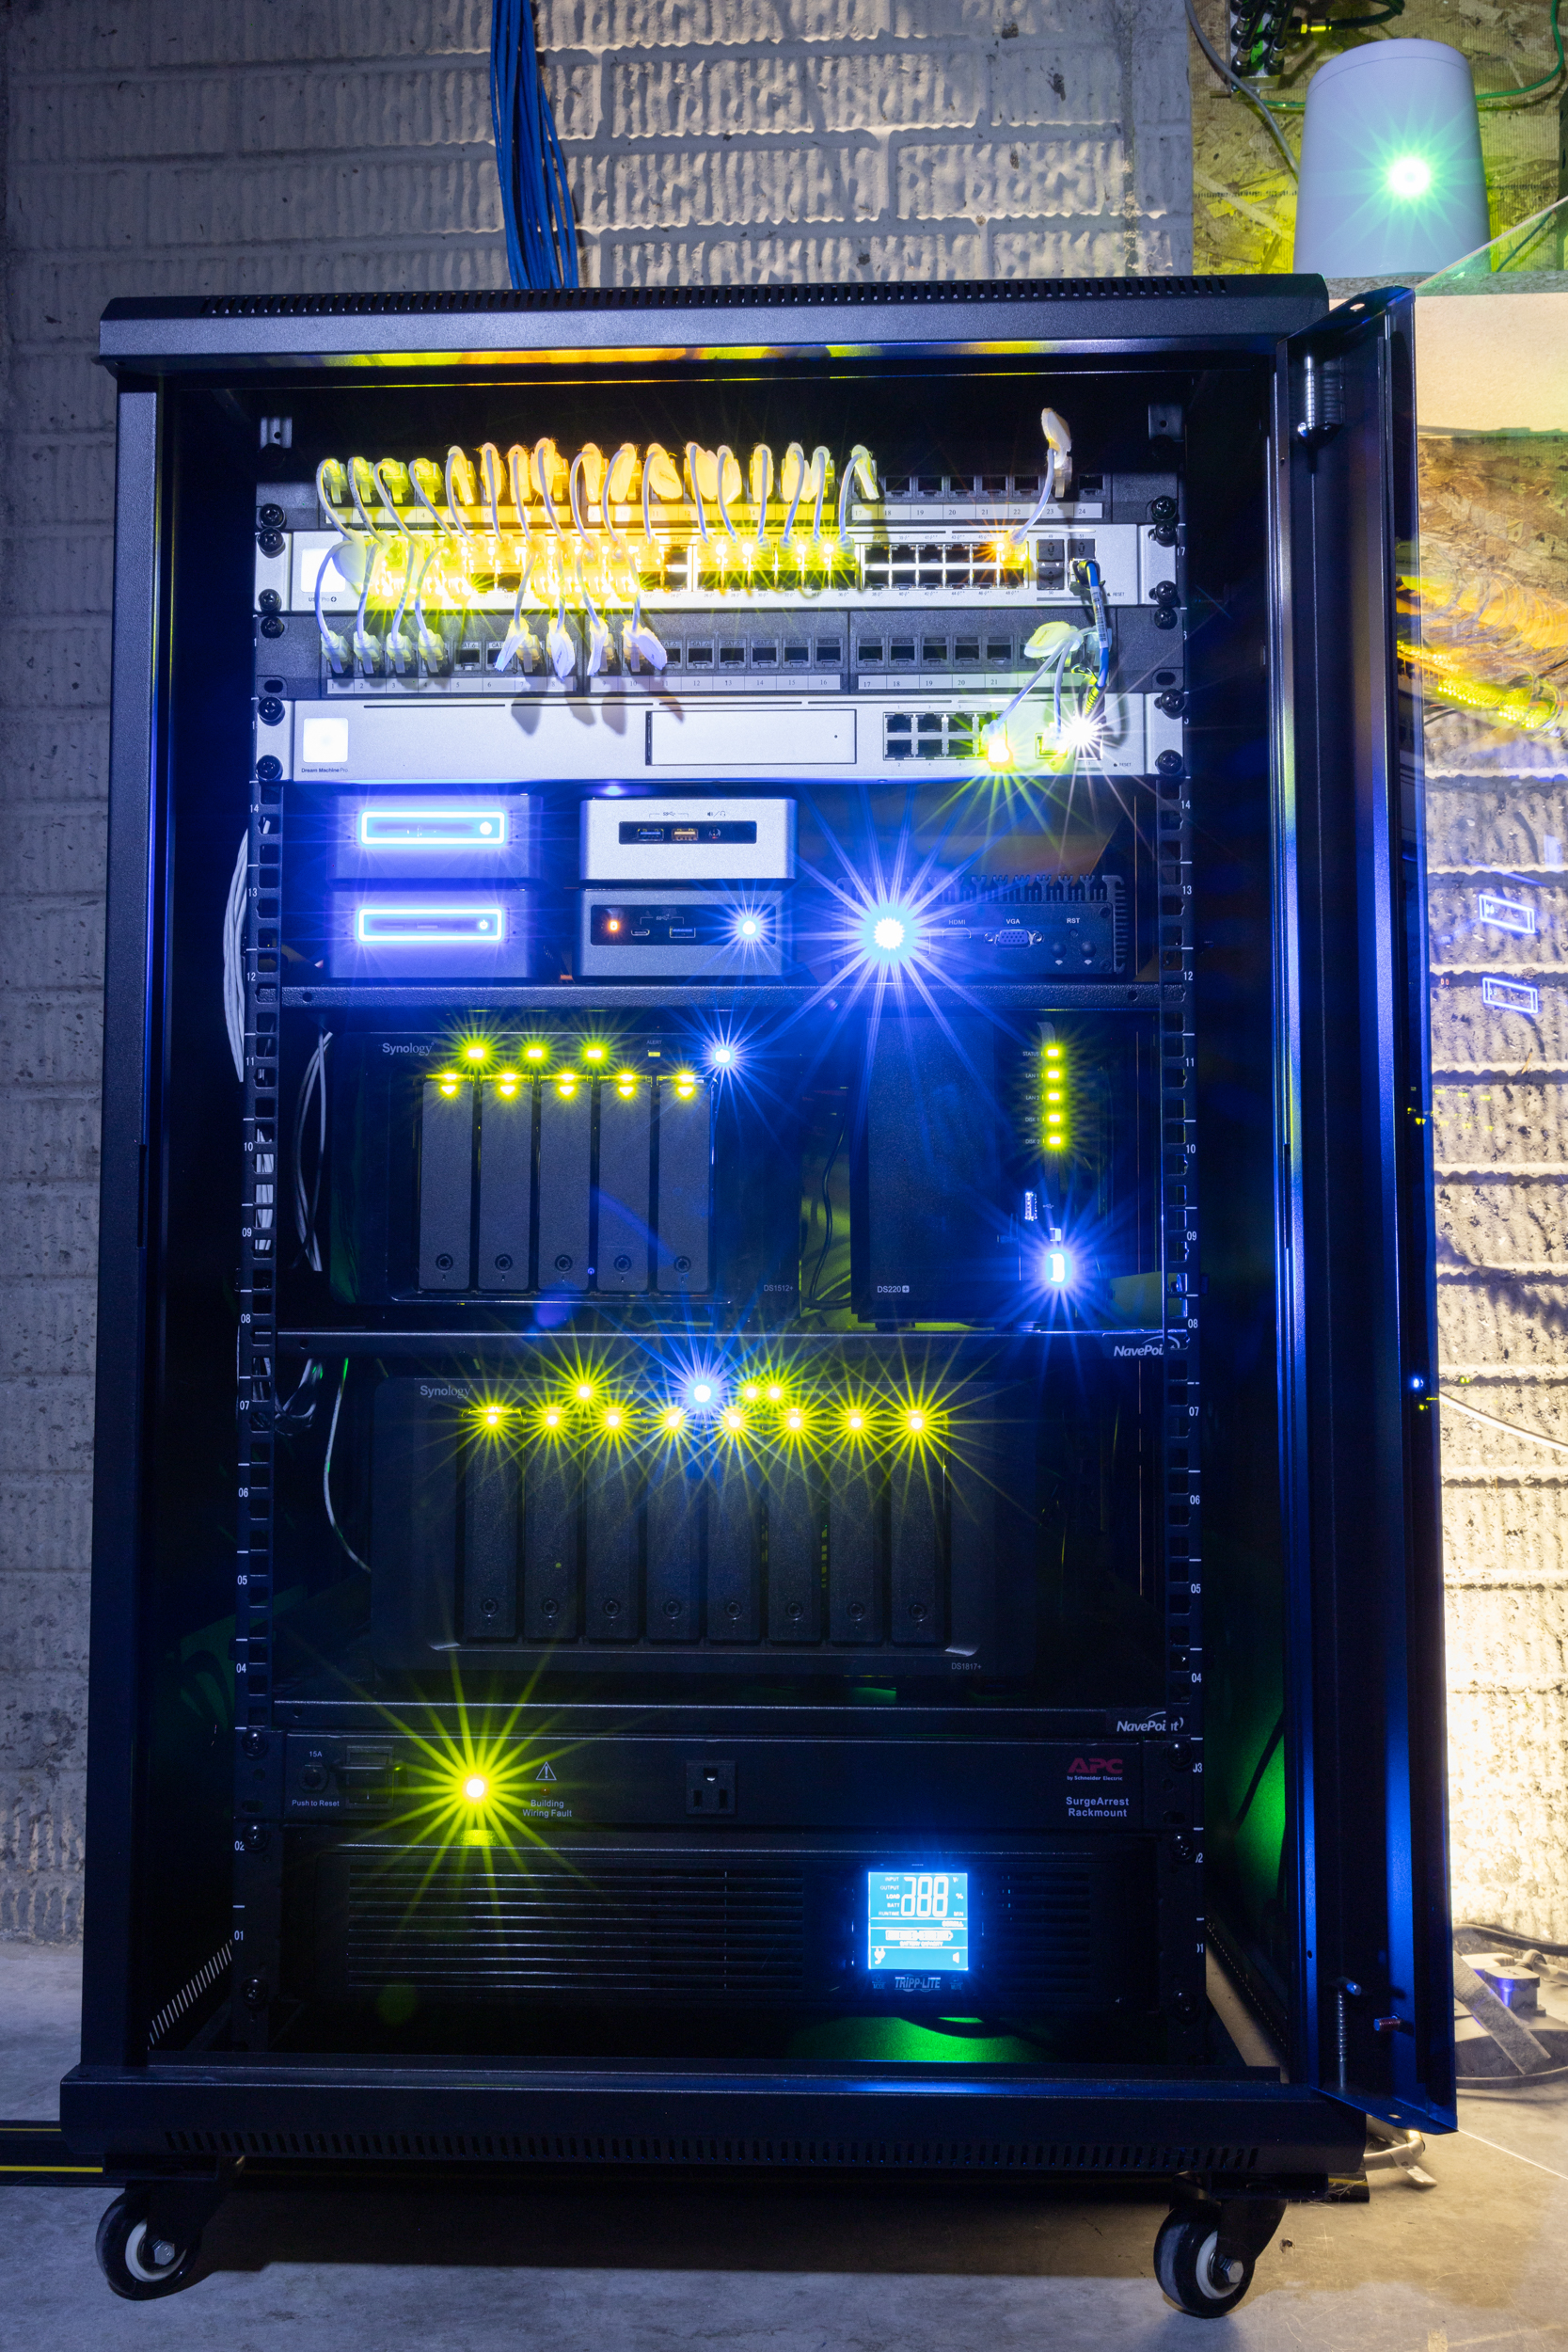
One thing I learned is to go large. I ran out of room in the 18U rack and wish I had started with a 24U, so I added a NavePoint 9U rack next to it for the newer mini PCs, the second switch, and their own UPS. Both have built in top fans, bottom electrical access, side doors, and a glass front door with lock, and the side rails are great for cable management.
NAS Servers and Cloud
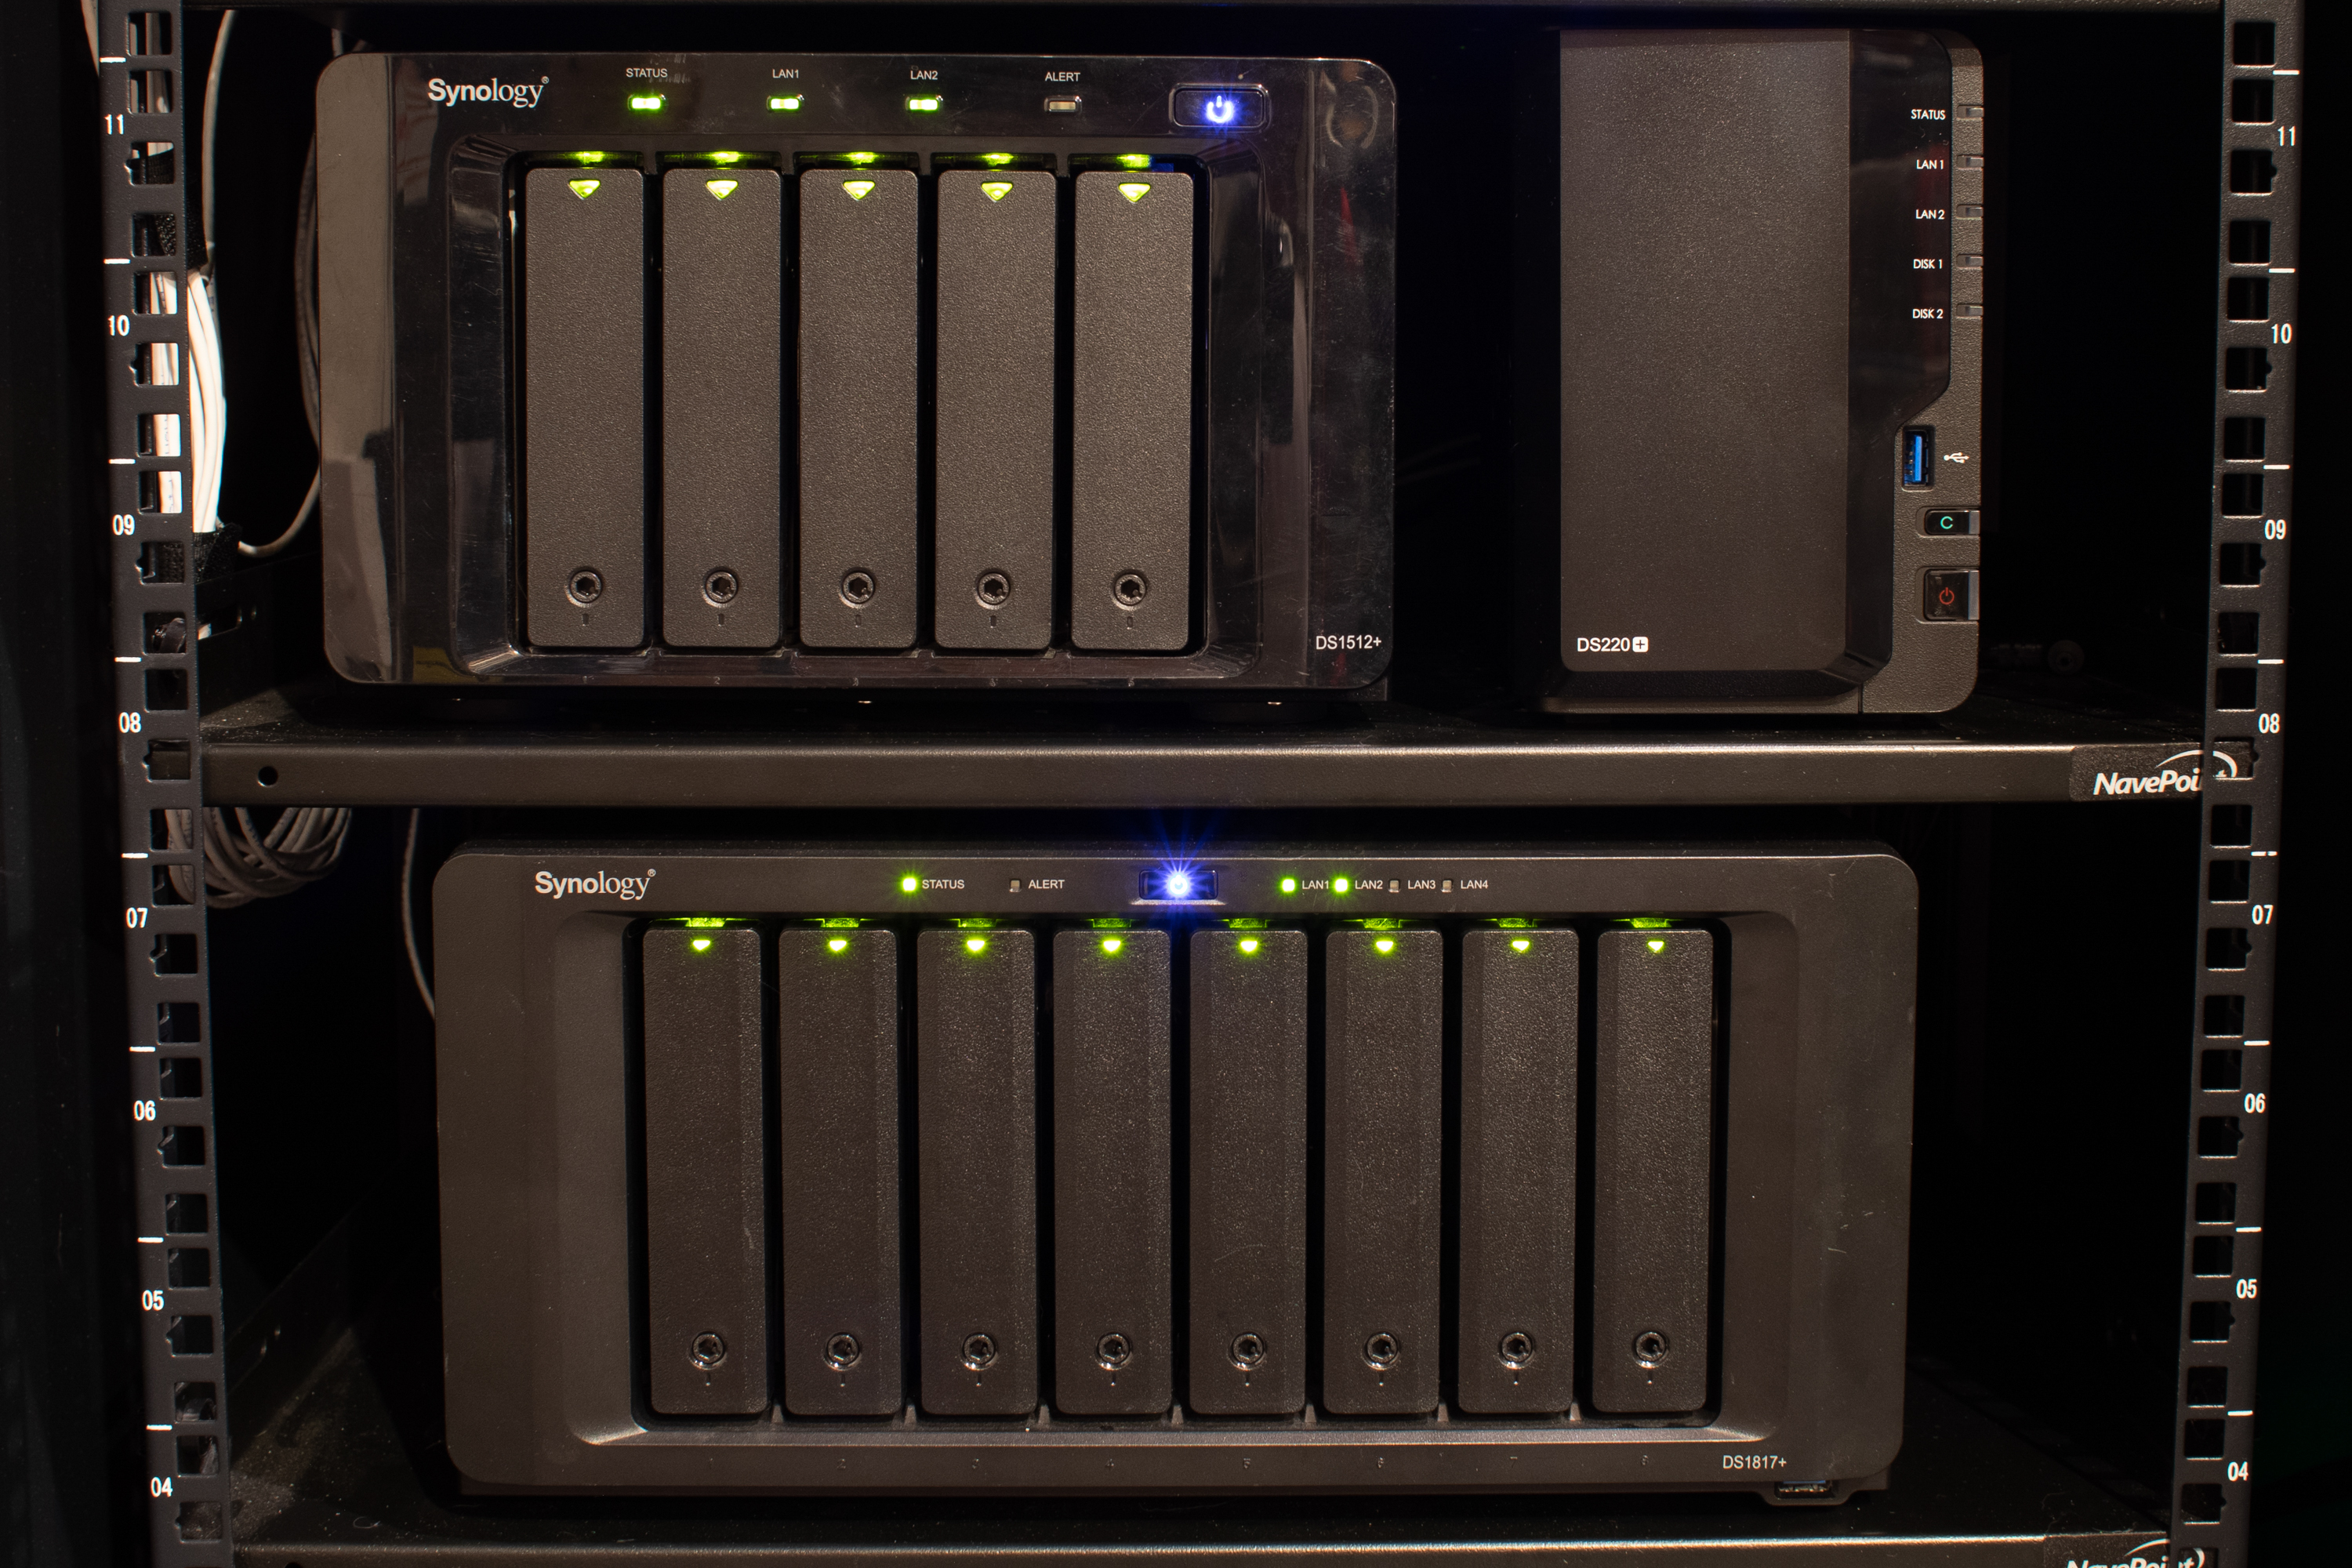
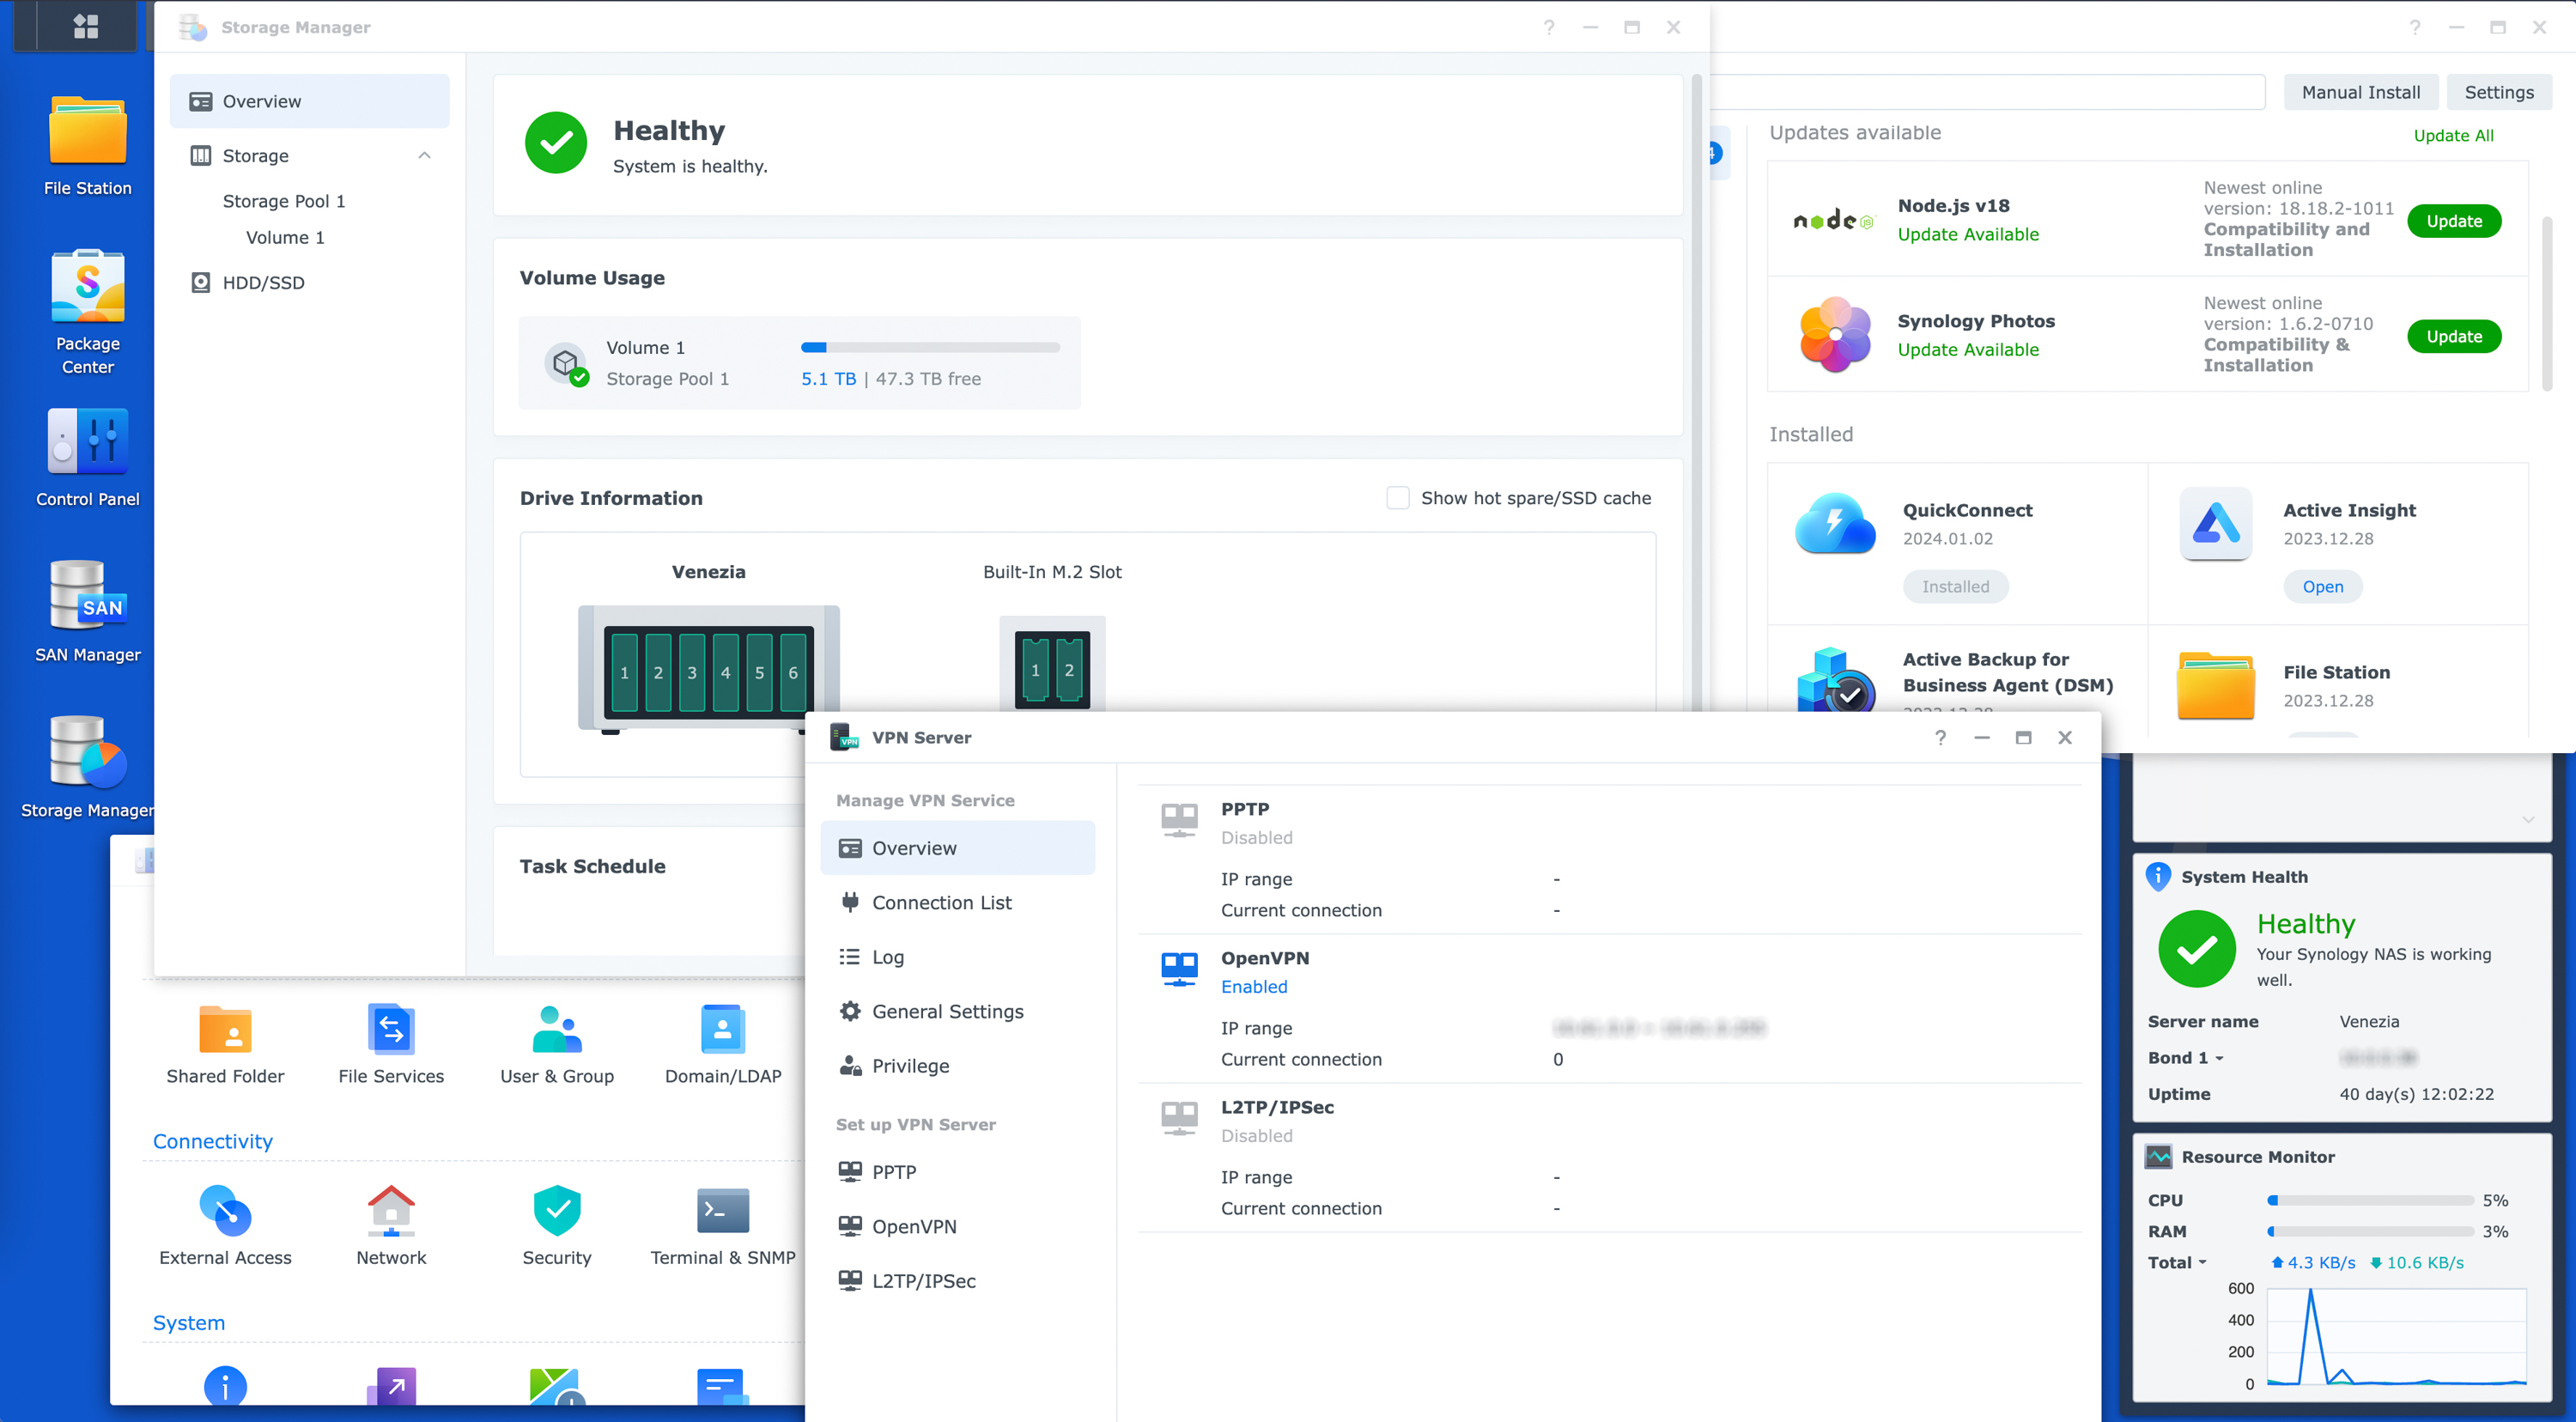
The most important part of my network is the NAS servers creating my personal cloud. Comprised of 4 NAS servers totaling 92.6TB in RAID 5, this system provides me with a robust, secure, cost-effective solution for photo syncing, backups, media streaming, and surveillance.
Camera recording moved off the NAS to Frigate, an open source NVR running on one of the mini PCs. A Coral TPU handles the object detection on every feed, so Home Assistant only bothers me when it actually sees a person or a car, and recordings stay on a local NVMe drive in that box.
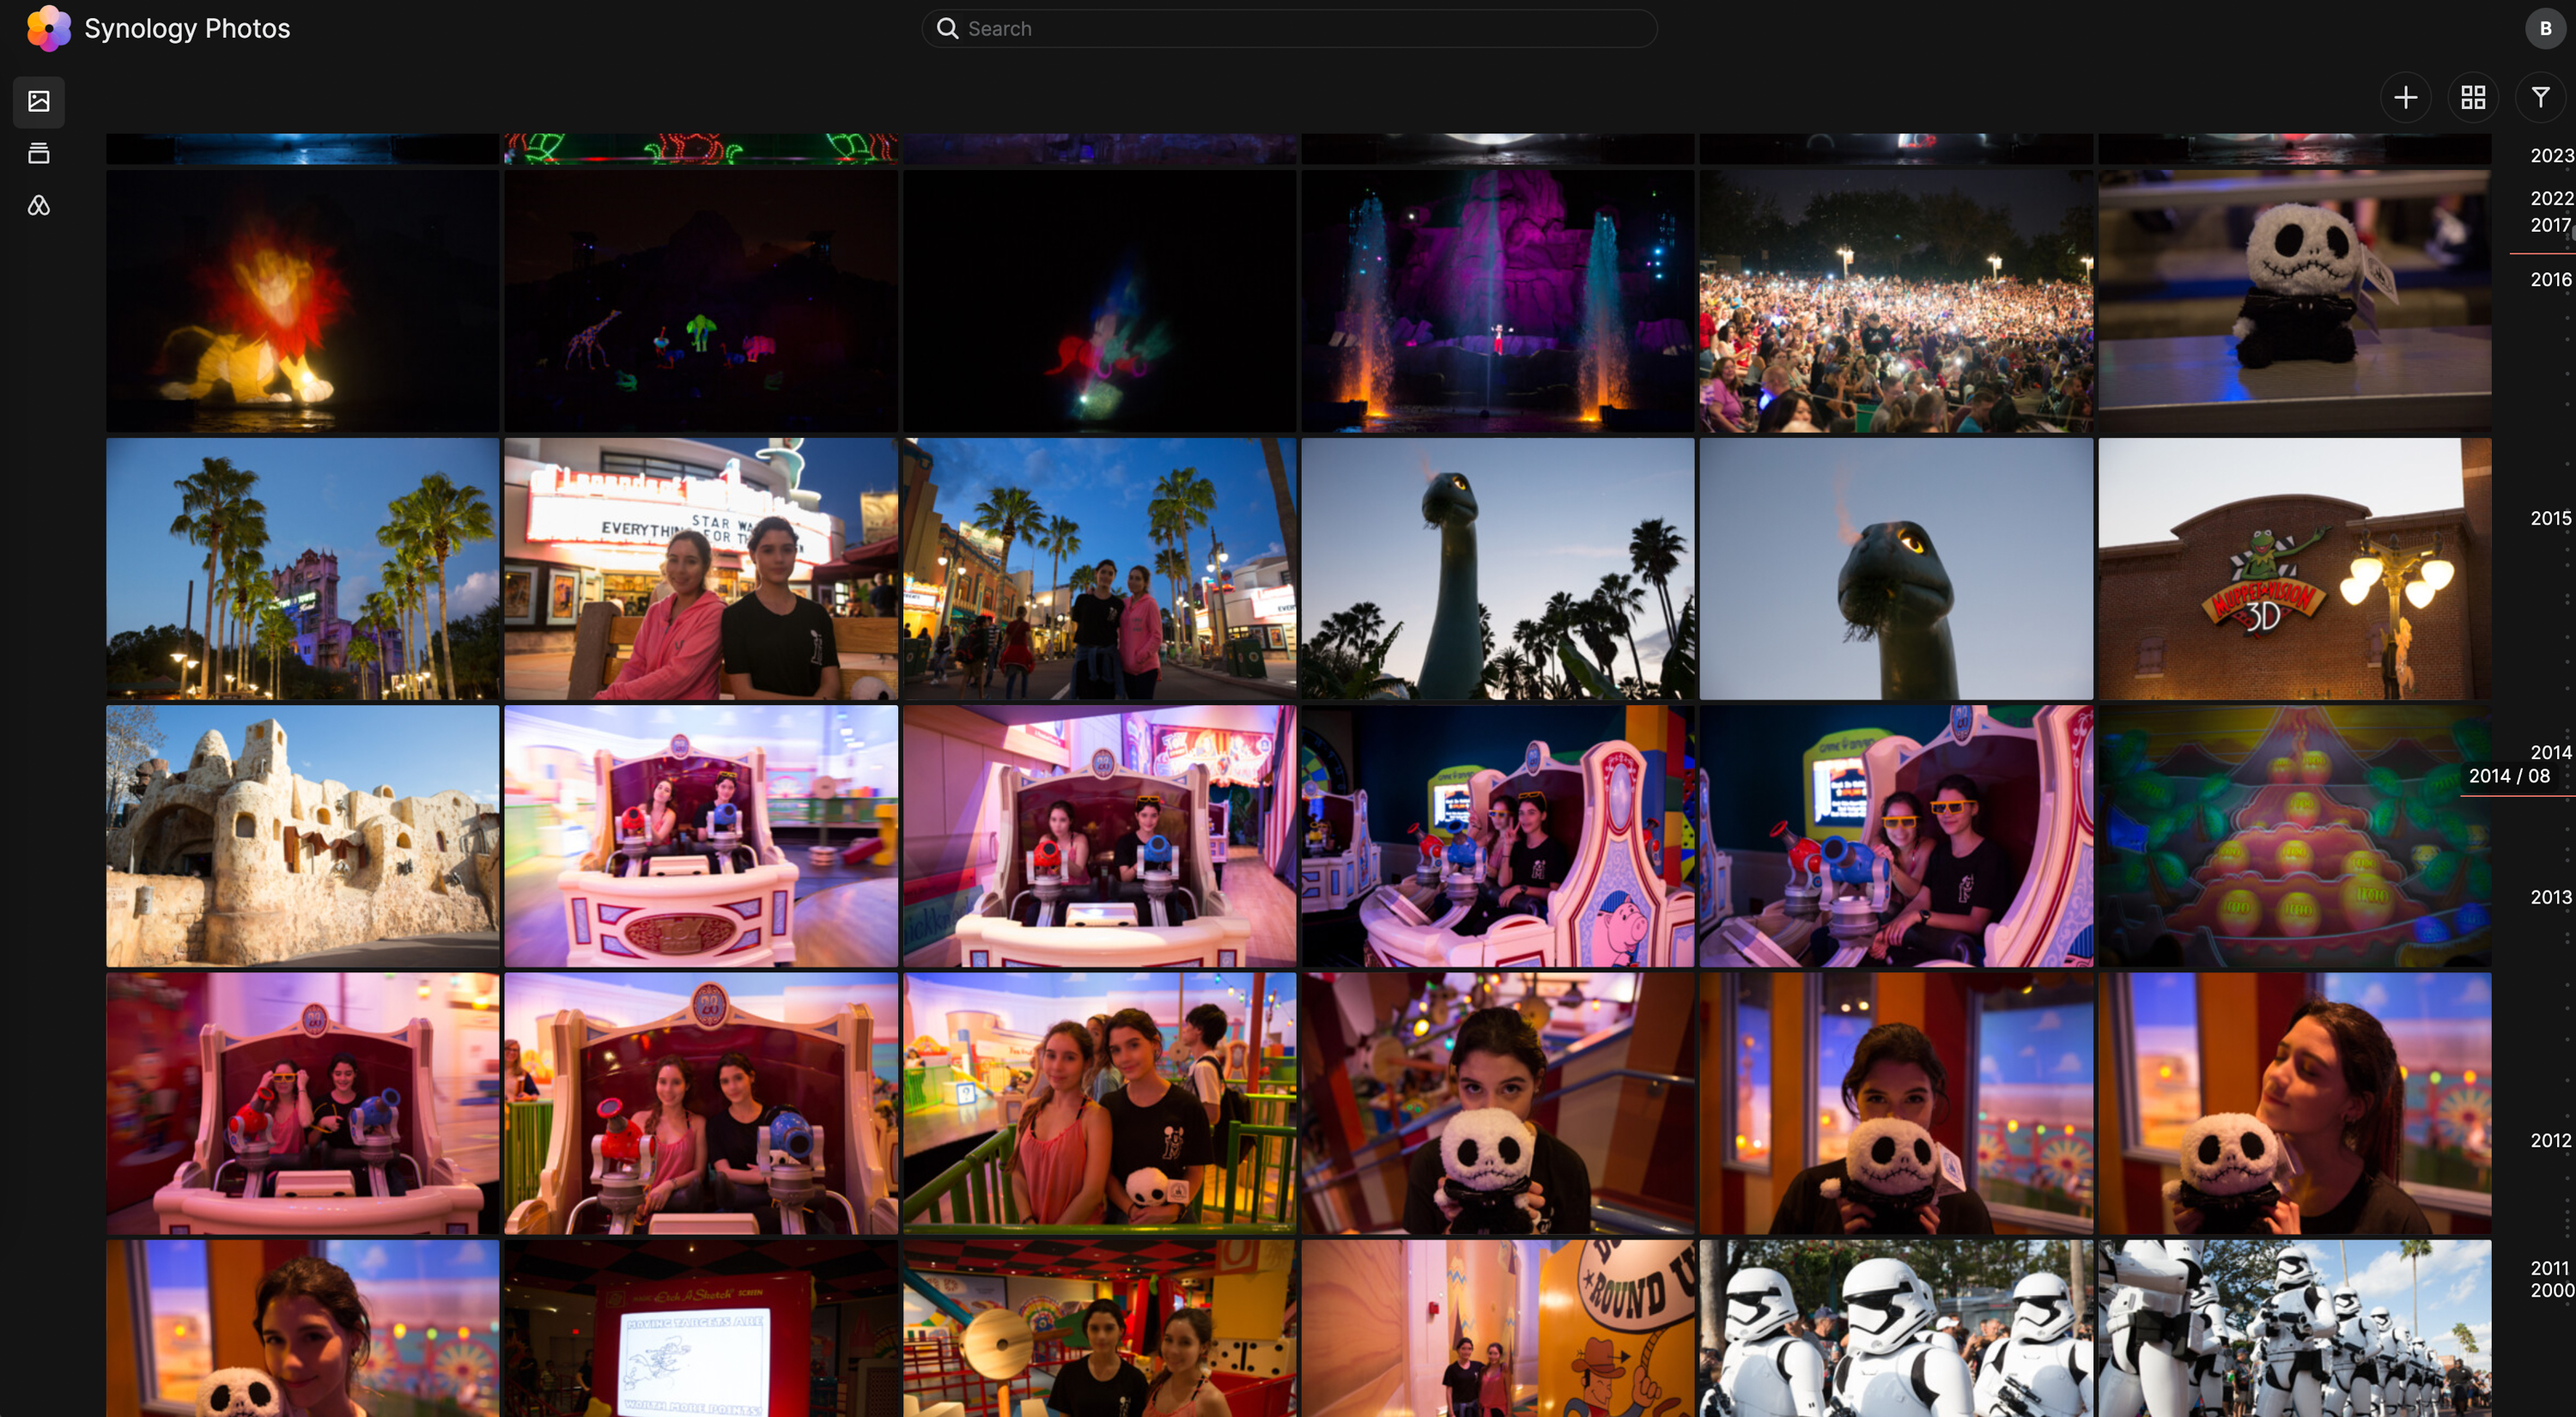
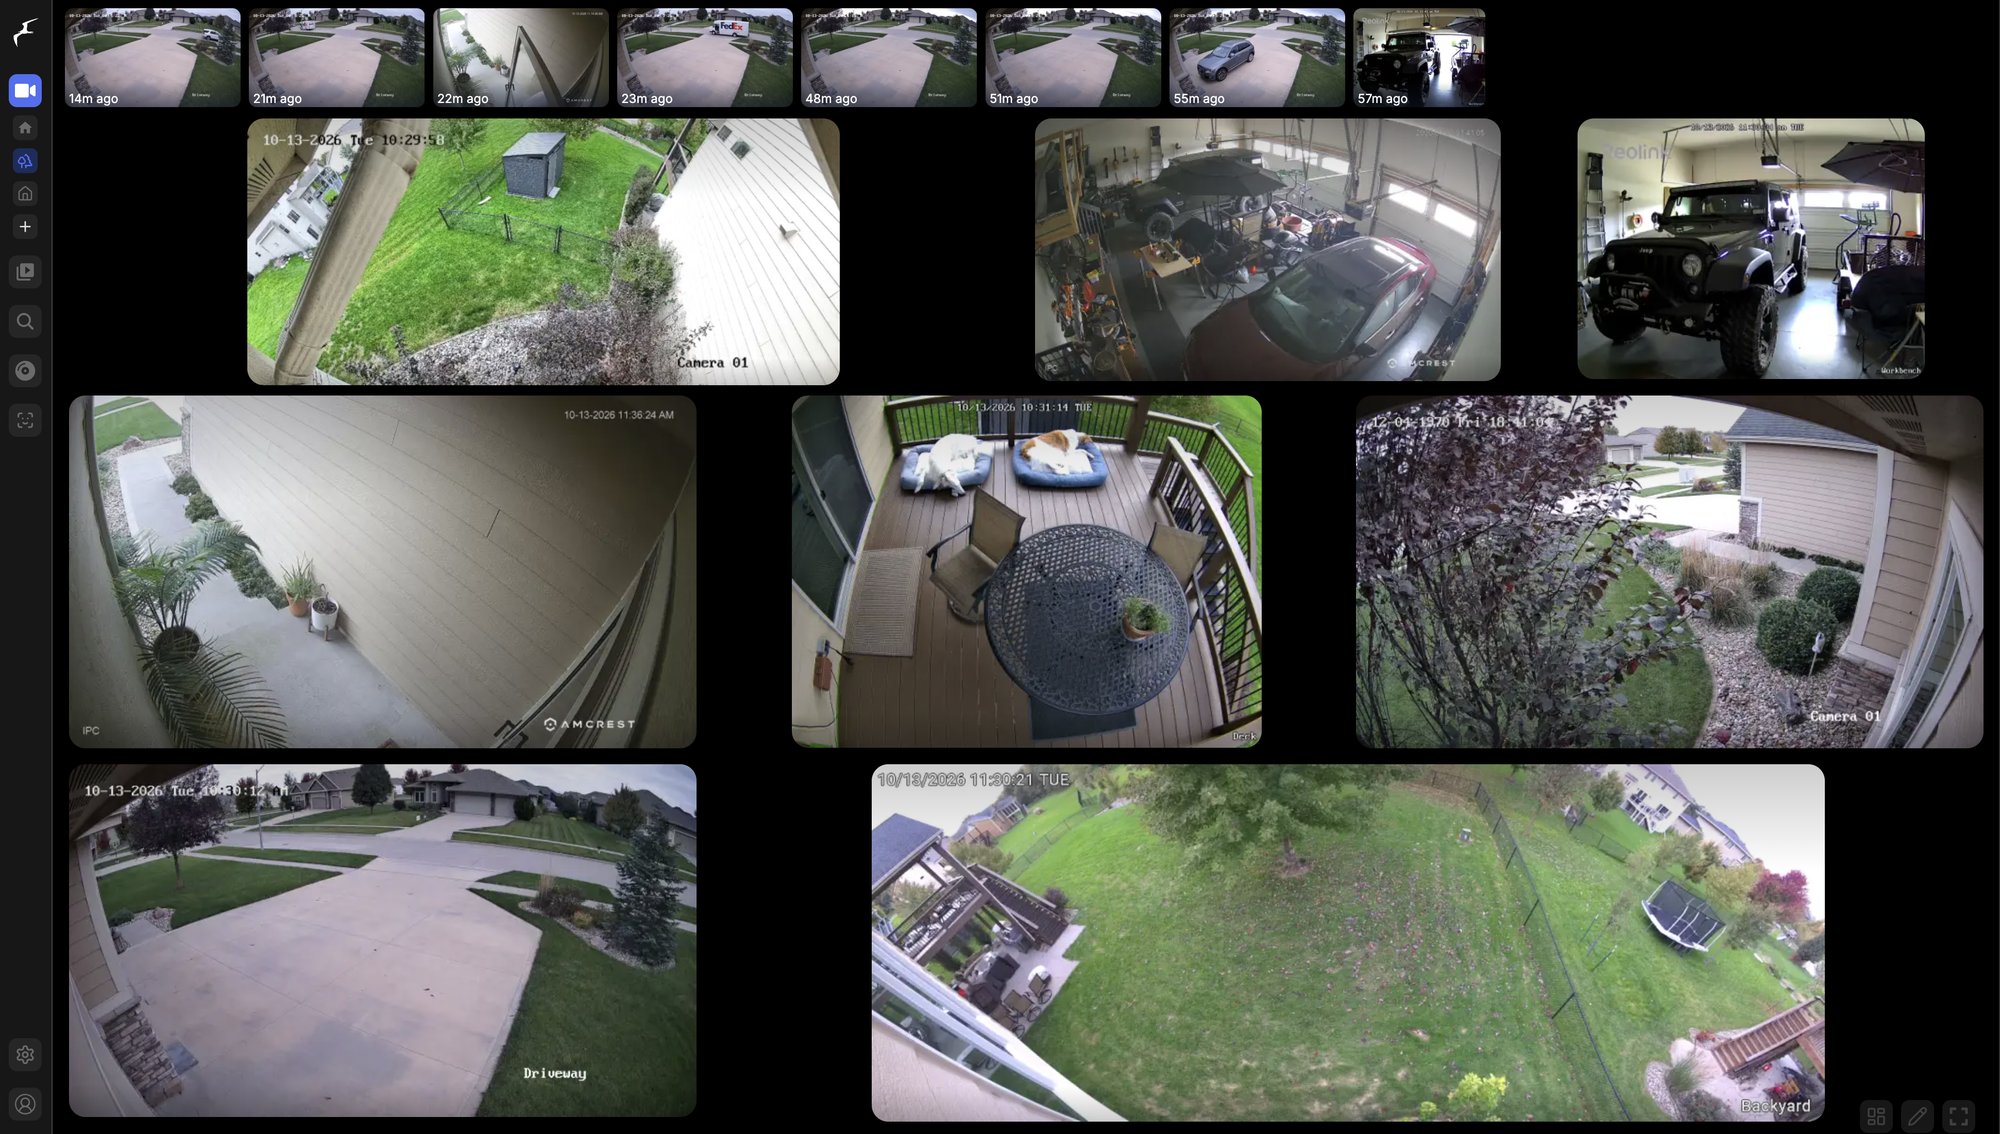
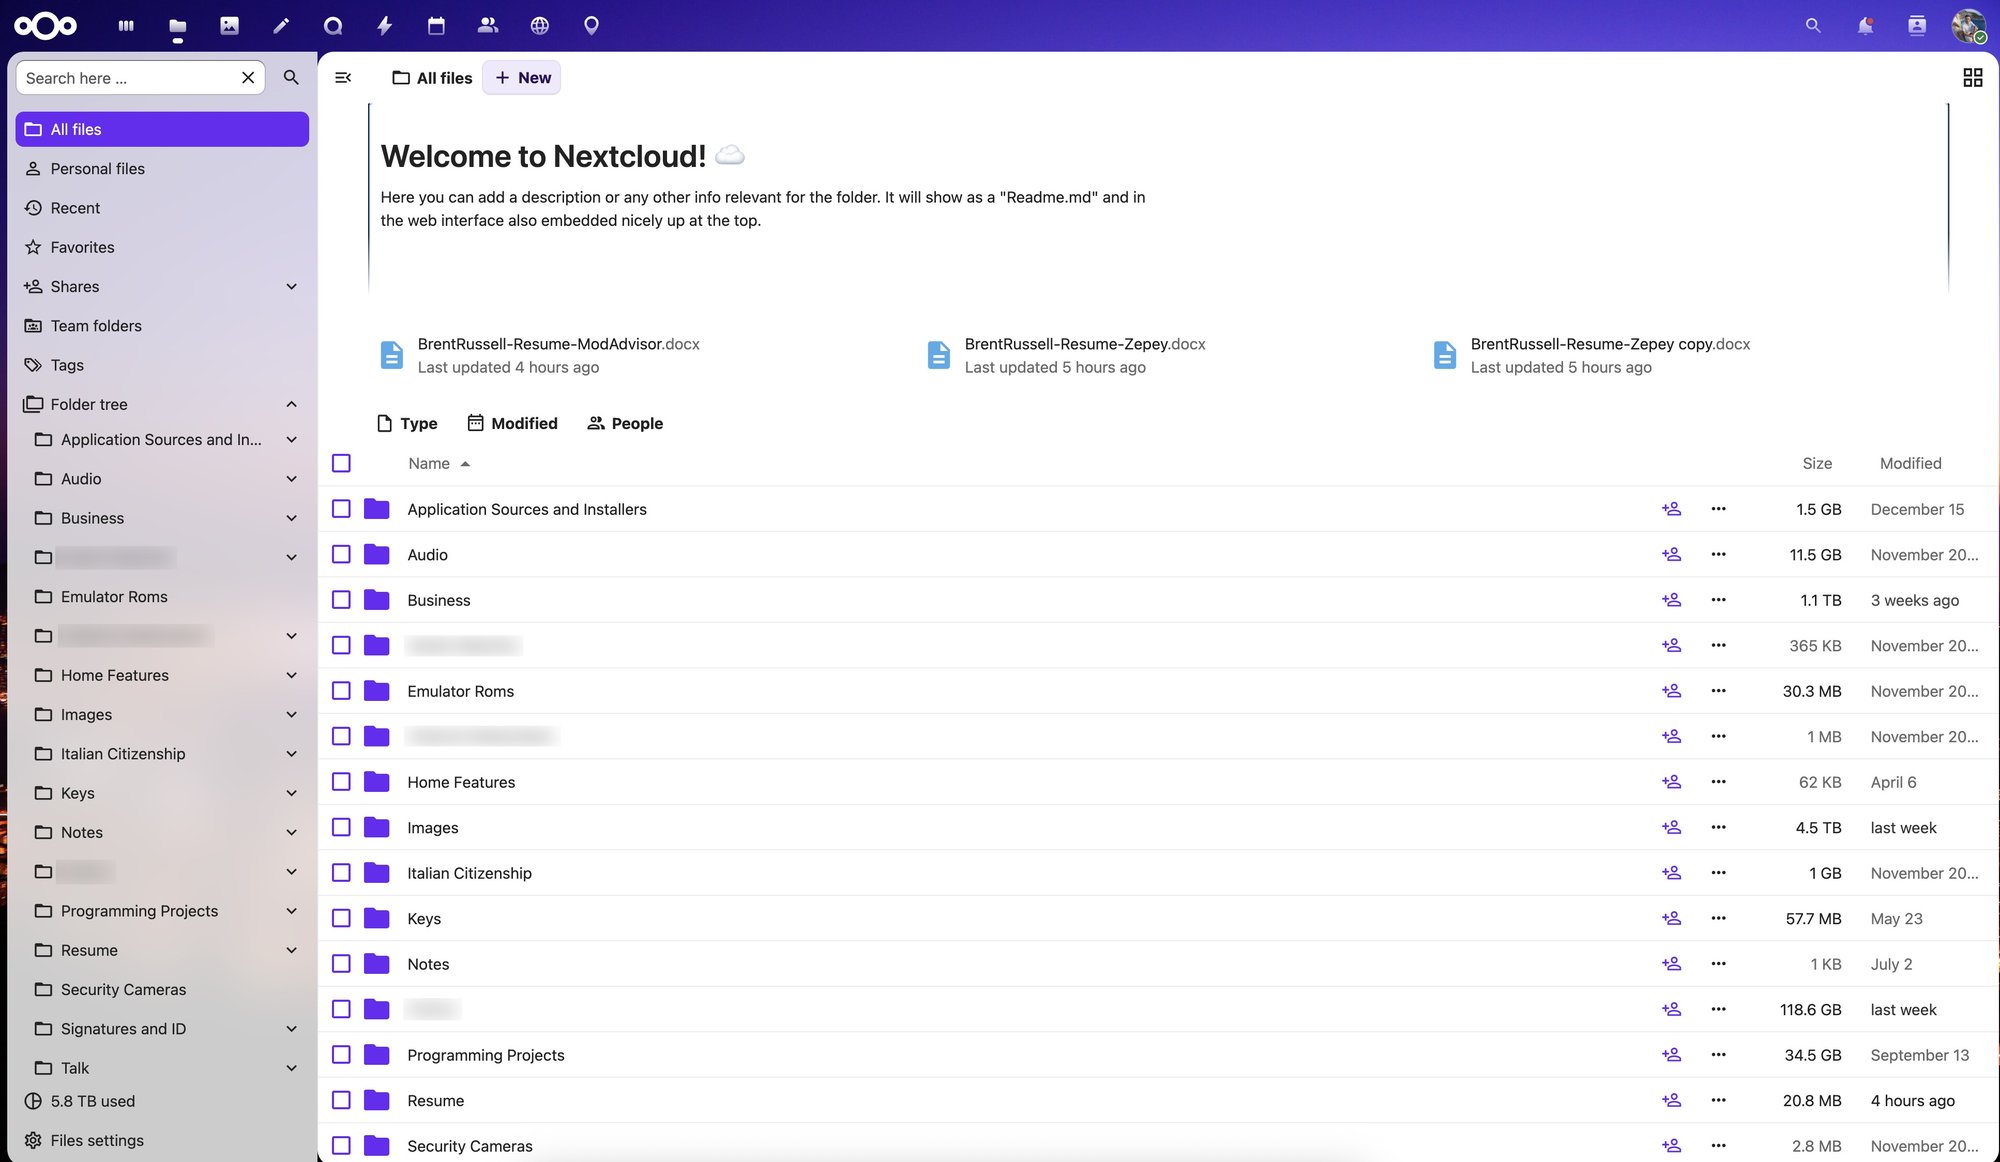
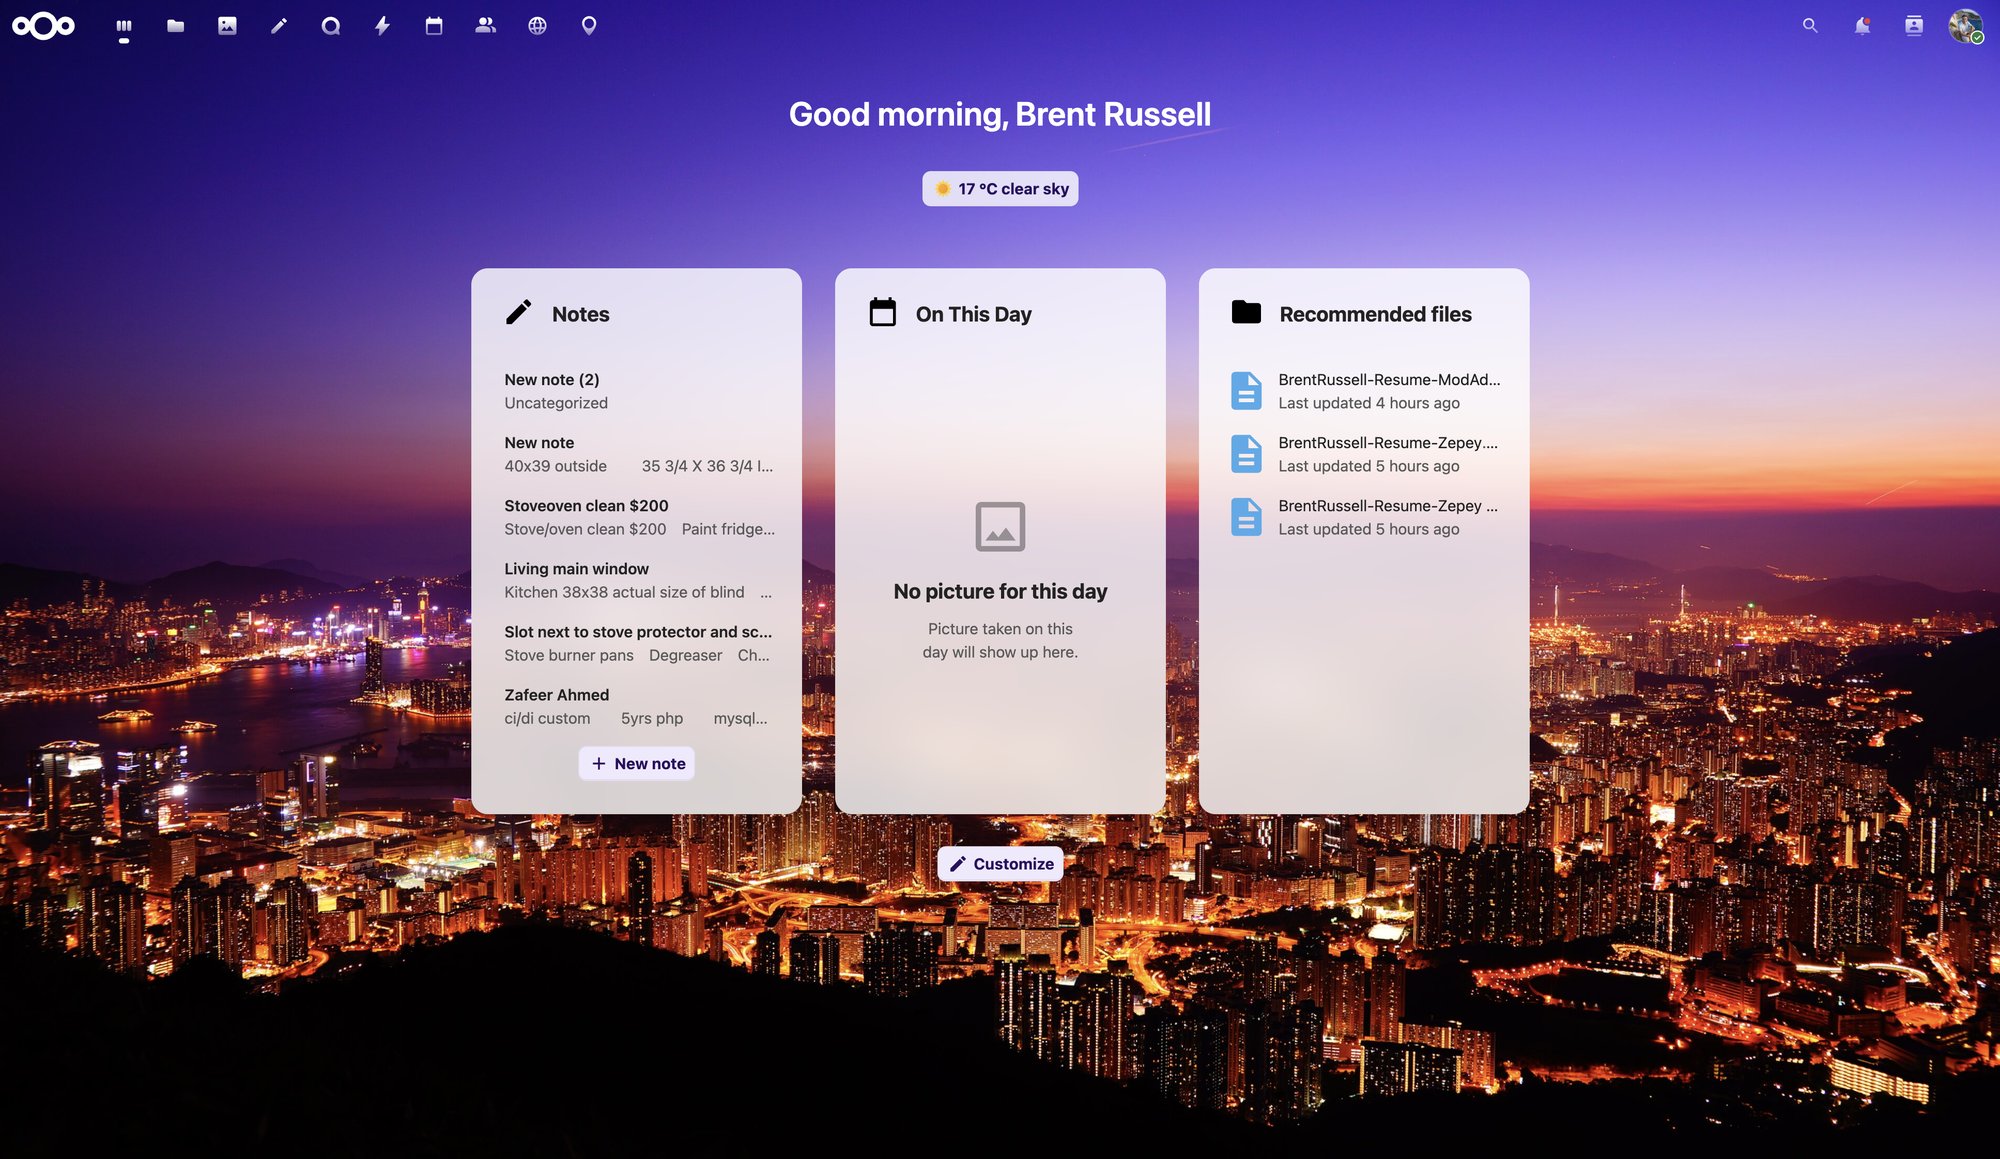
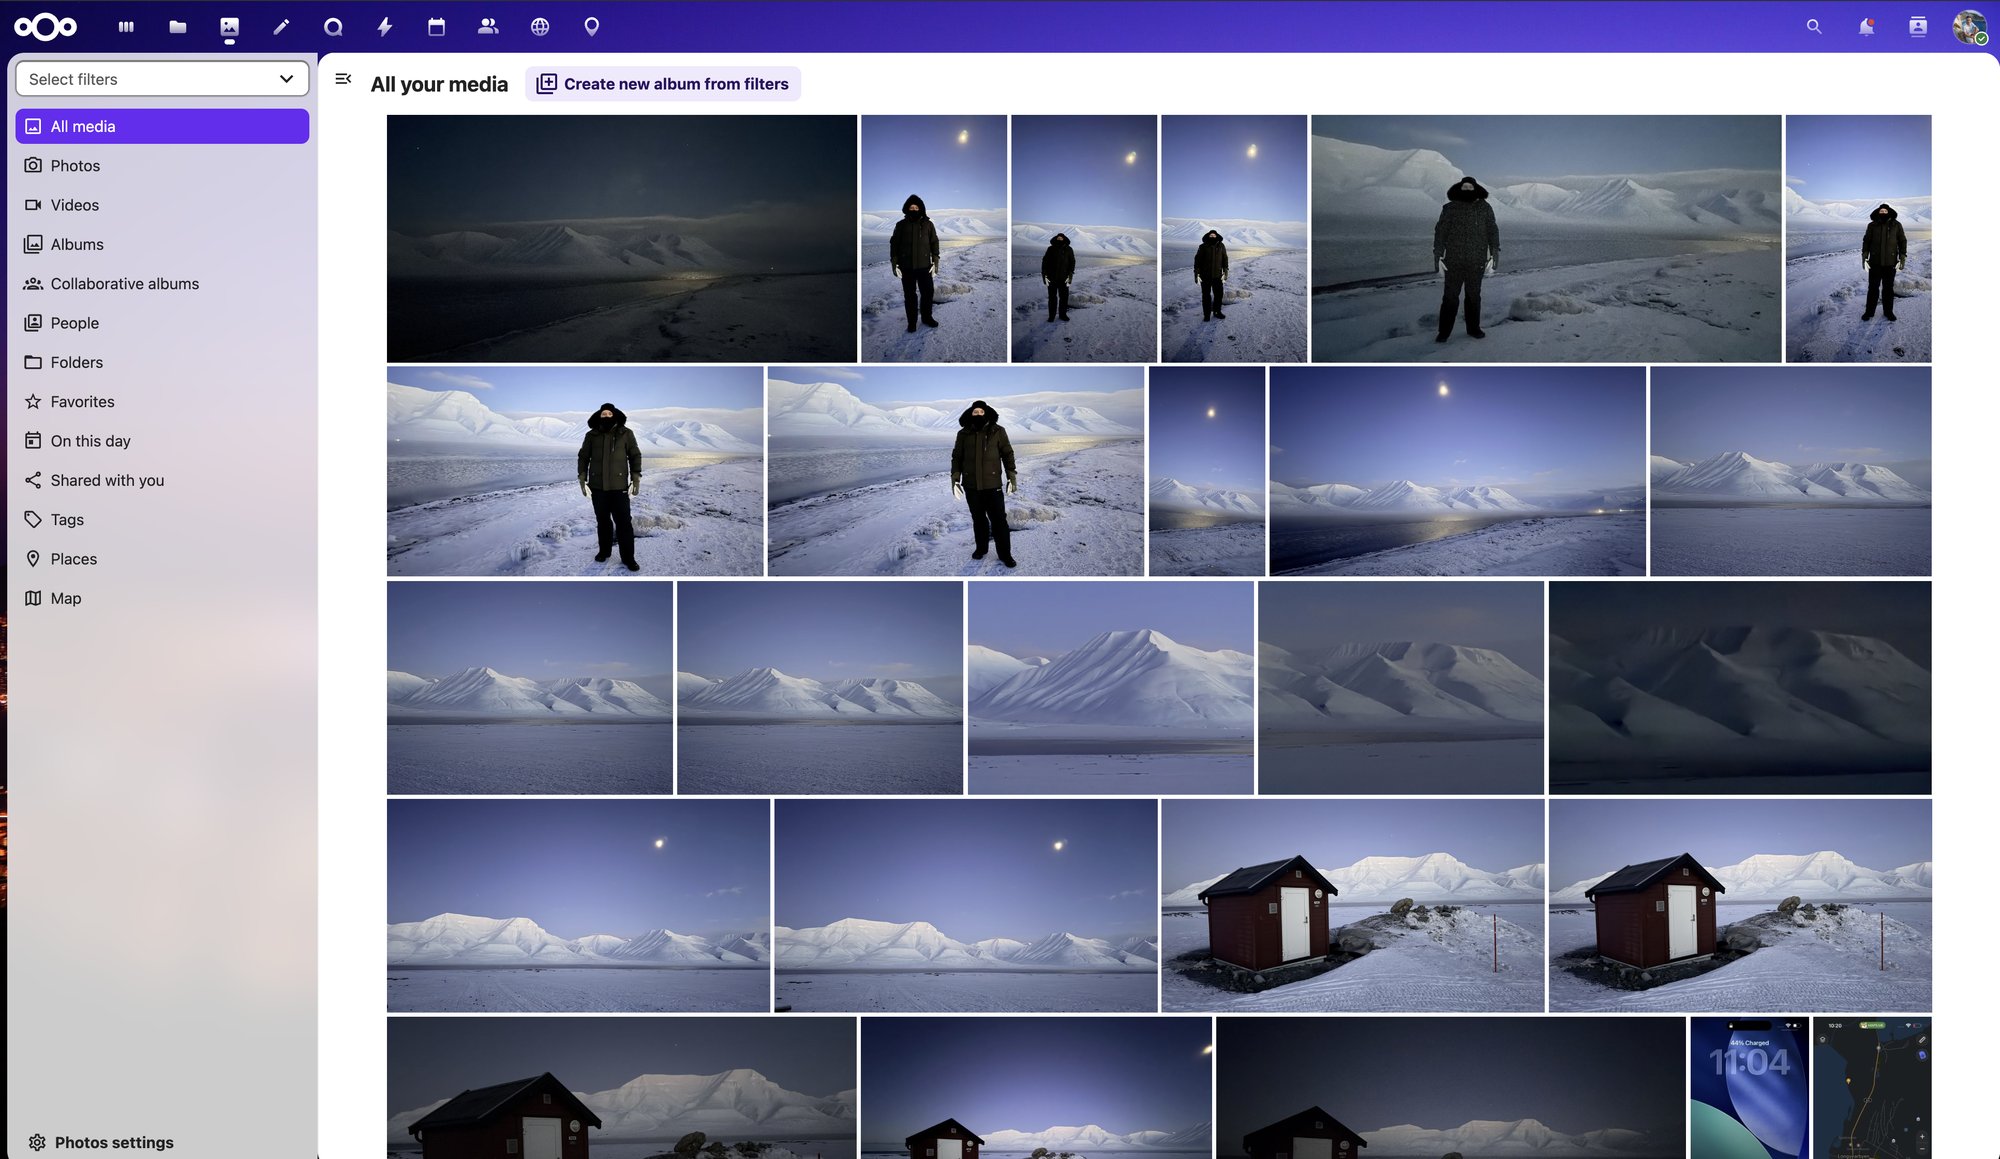
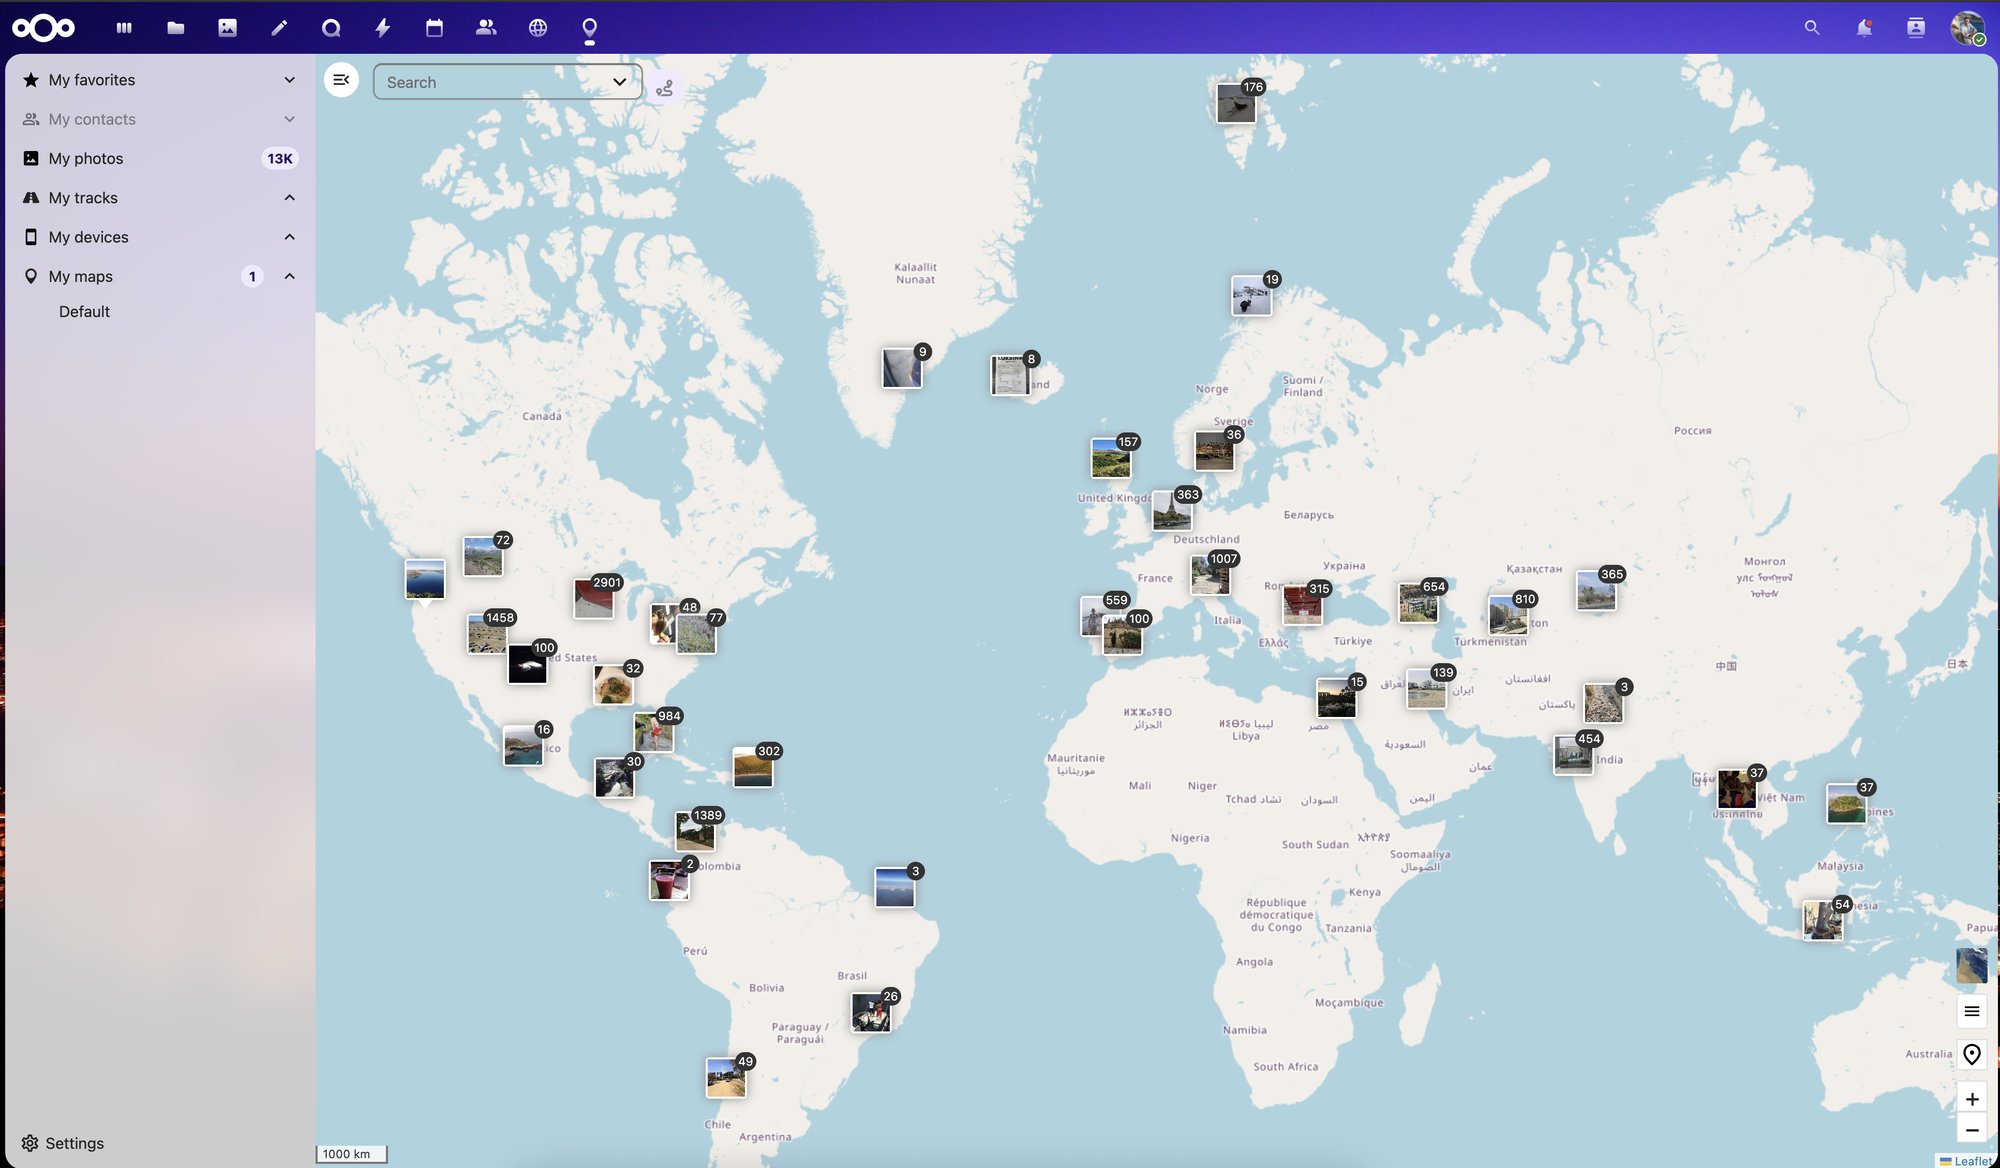
Alongside the NAS boxes I run Nextcloud on a Linux box with three 8TB NVMe drives in RAID 5. It syncs my calendar, photos, files, and notes from all my devices to my personal cloud hosted on my Home Lab, so my phone, laptop, and desktop always see the same thing. The photo map is a favorite: every picture I have taken with my phone is plotted where it was shot.
NVMe drives run hot when they are busy, and these were climbing high enough under a RAID rebuild to be a worry. I designed and 3D printed a custom base for the box that holds a large fan blowing across the drives, which brought them down to 38C under load.
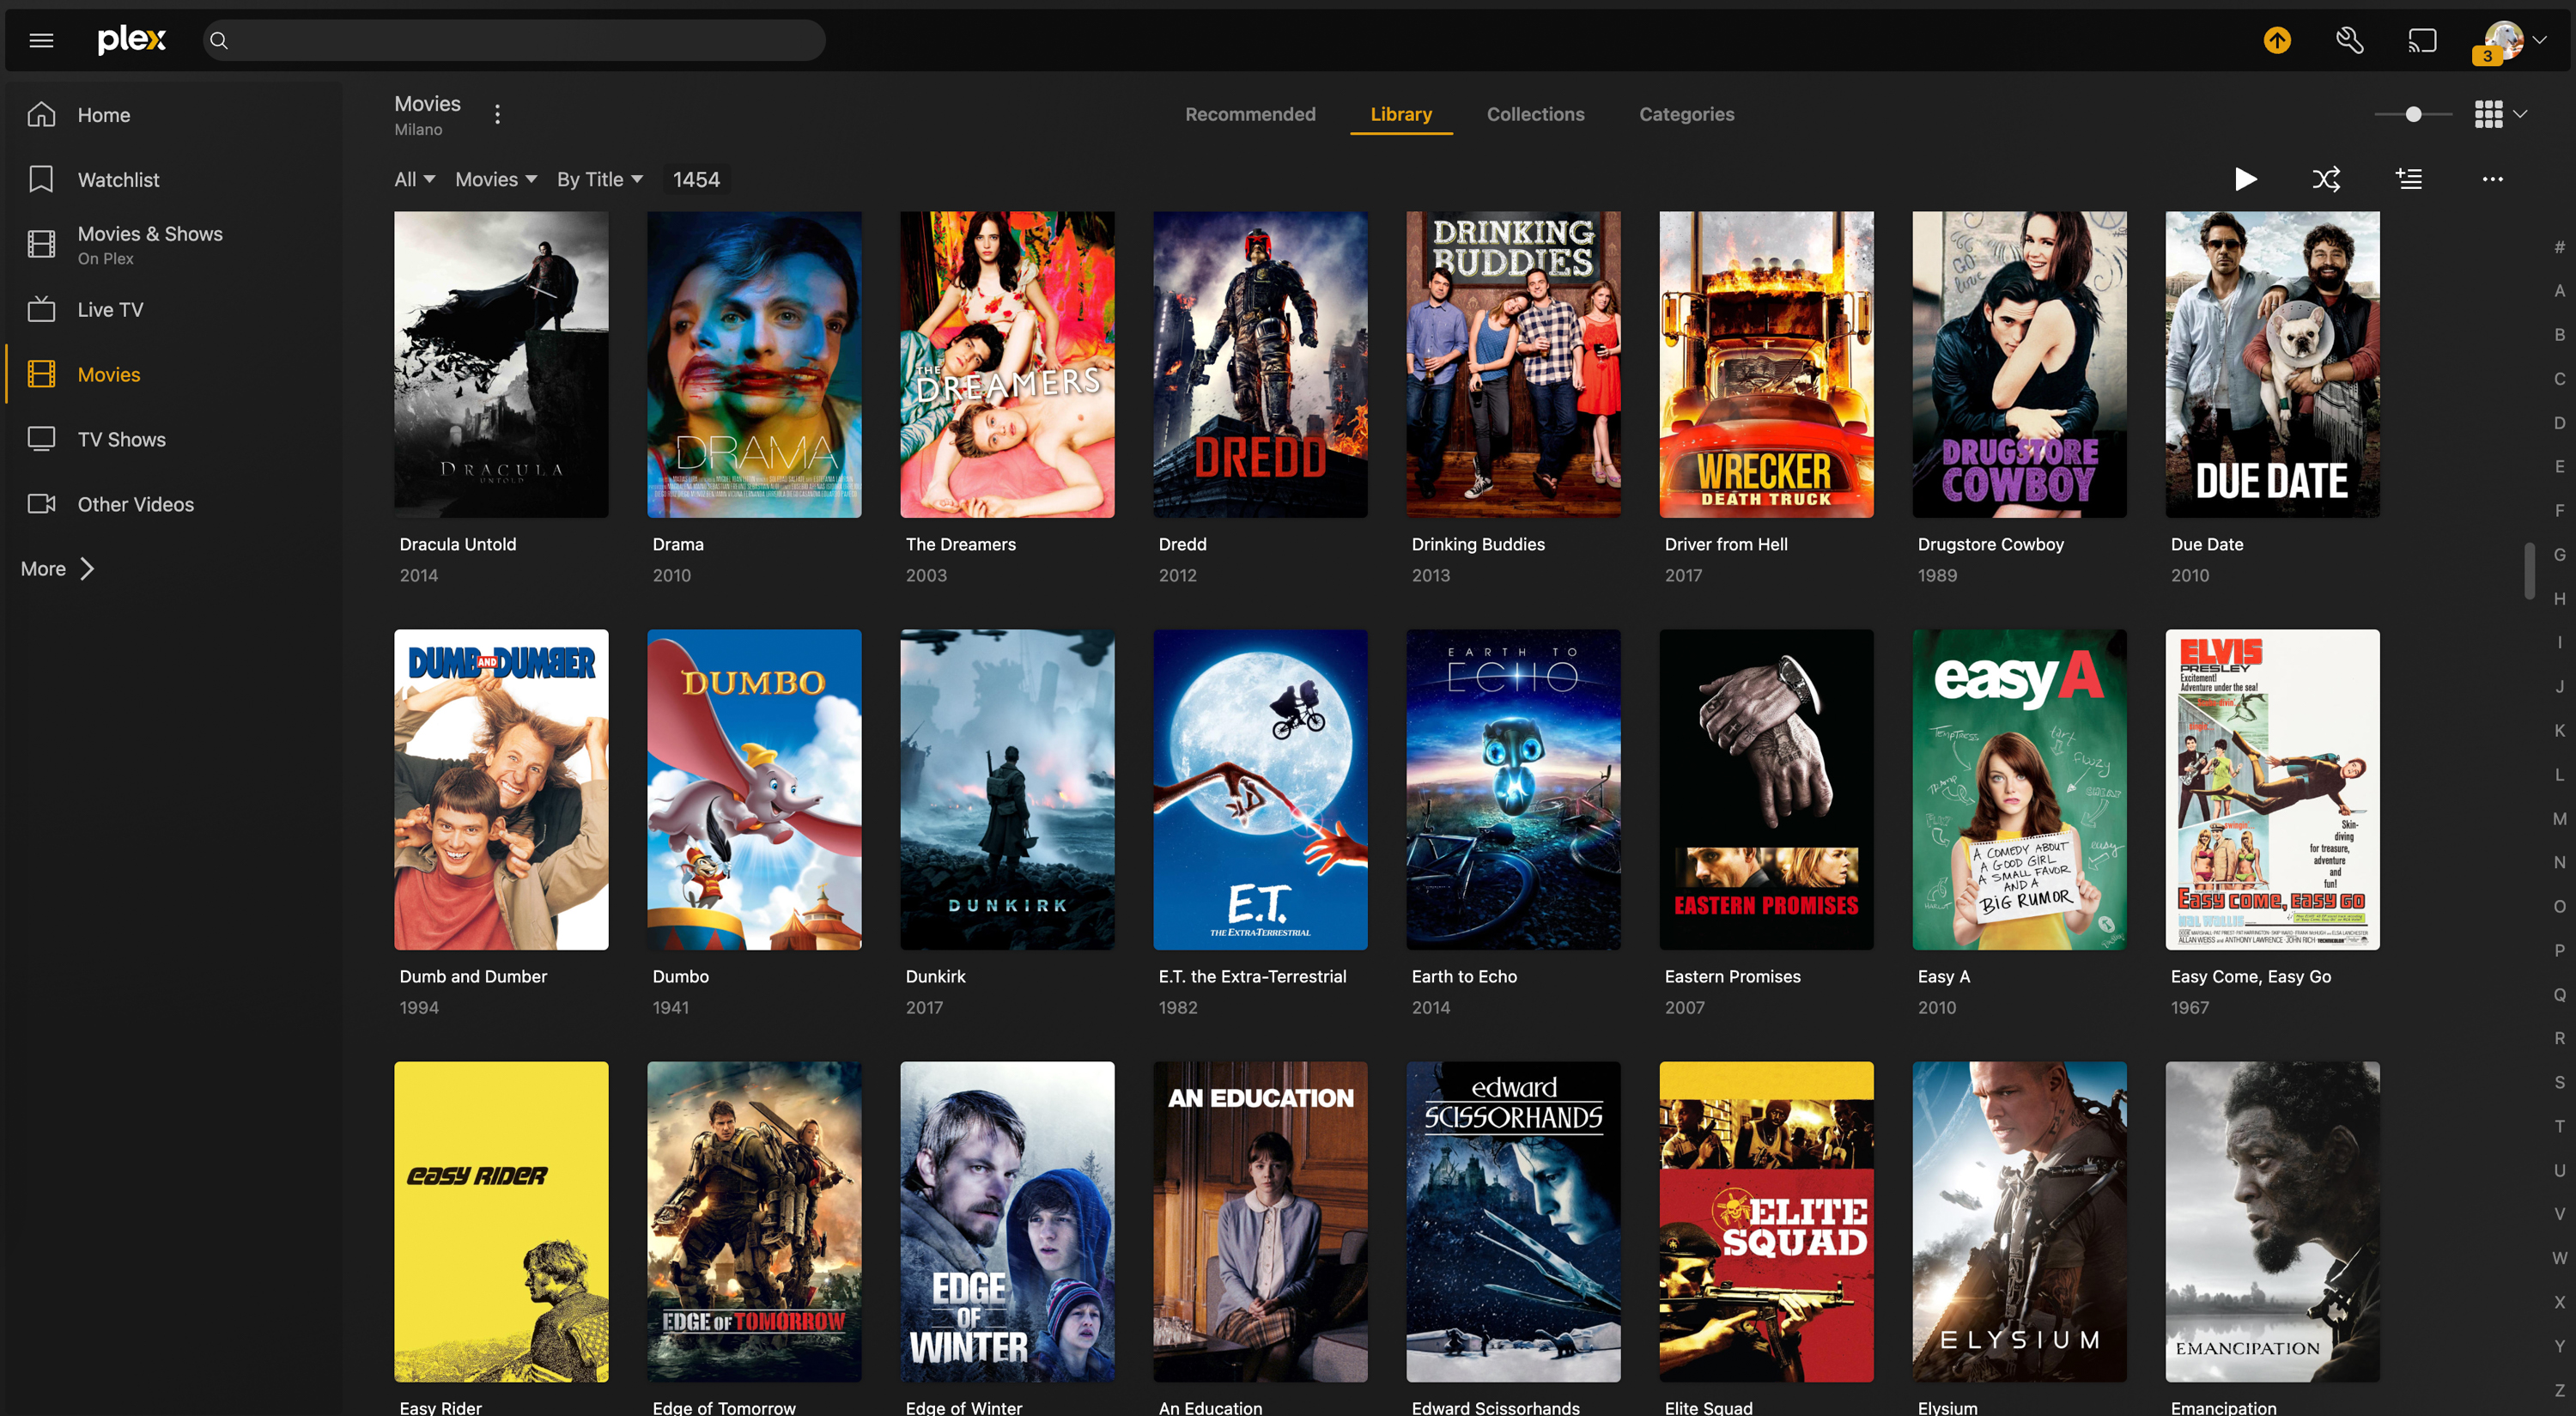
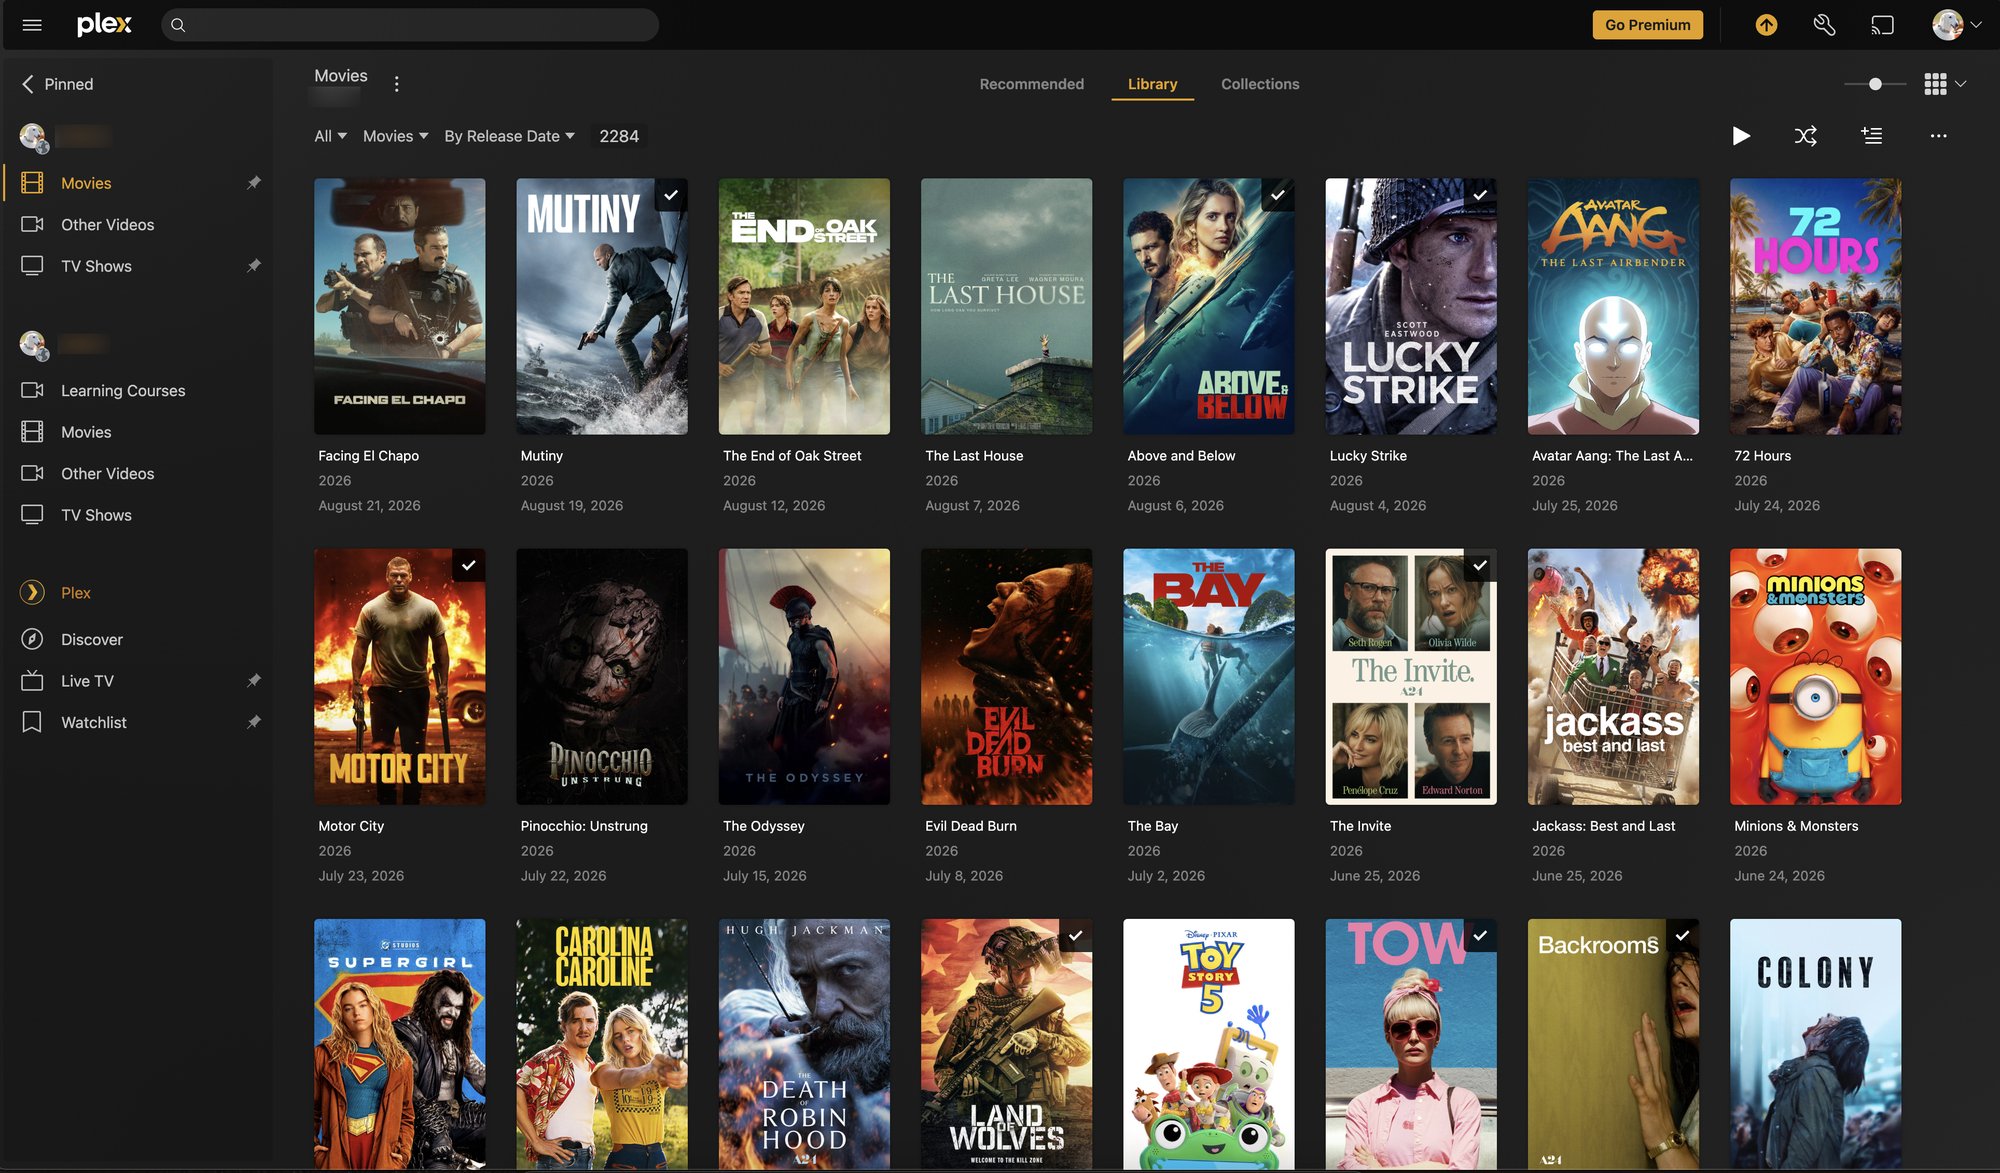
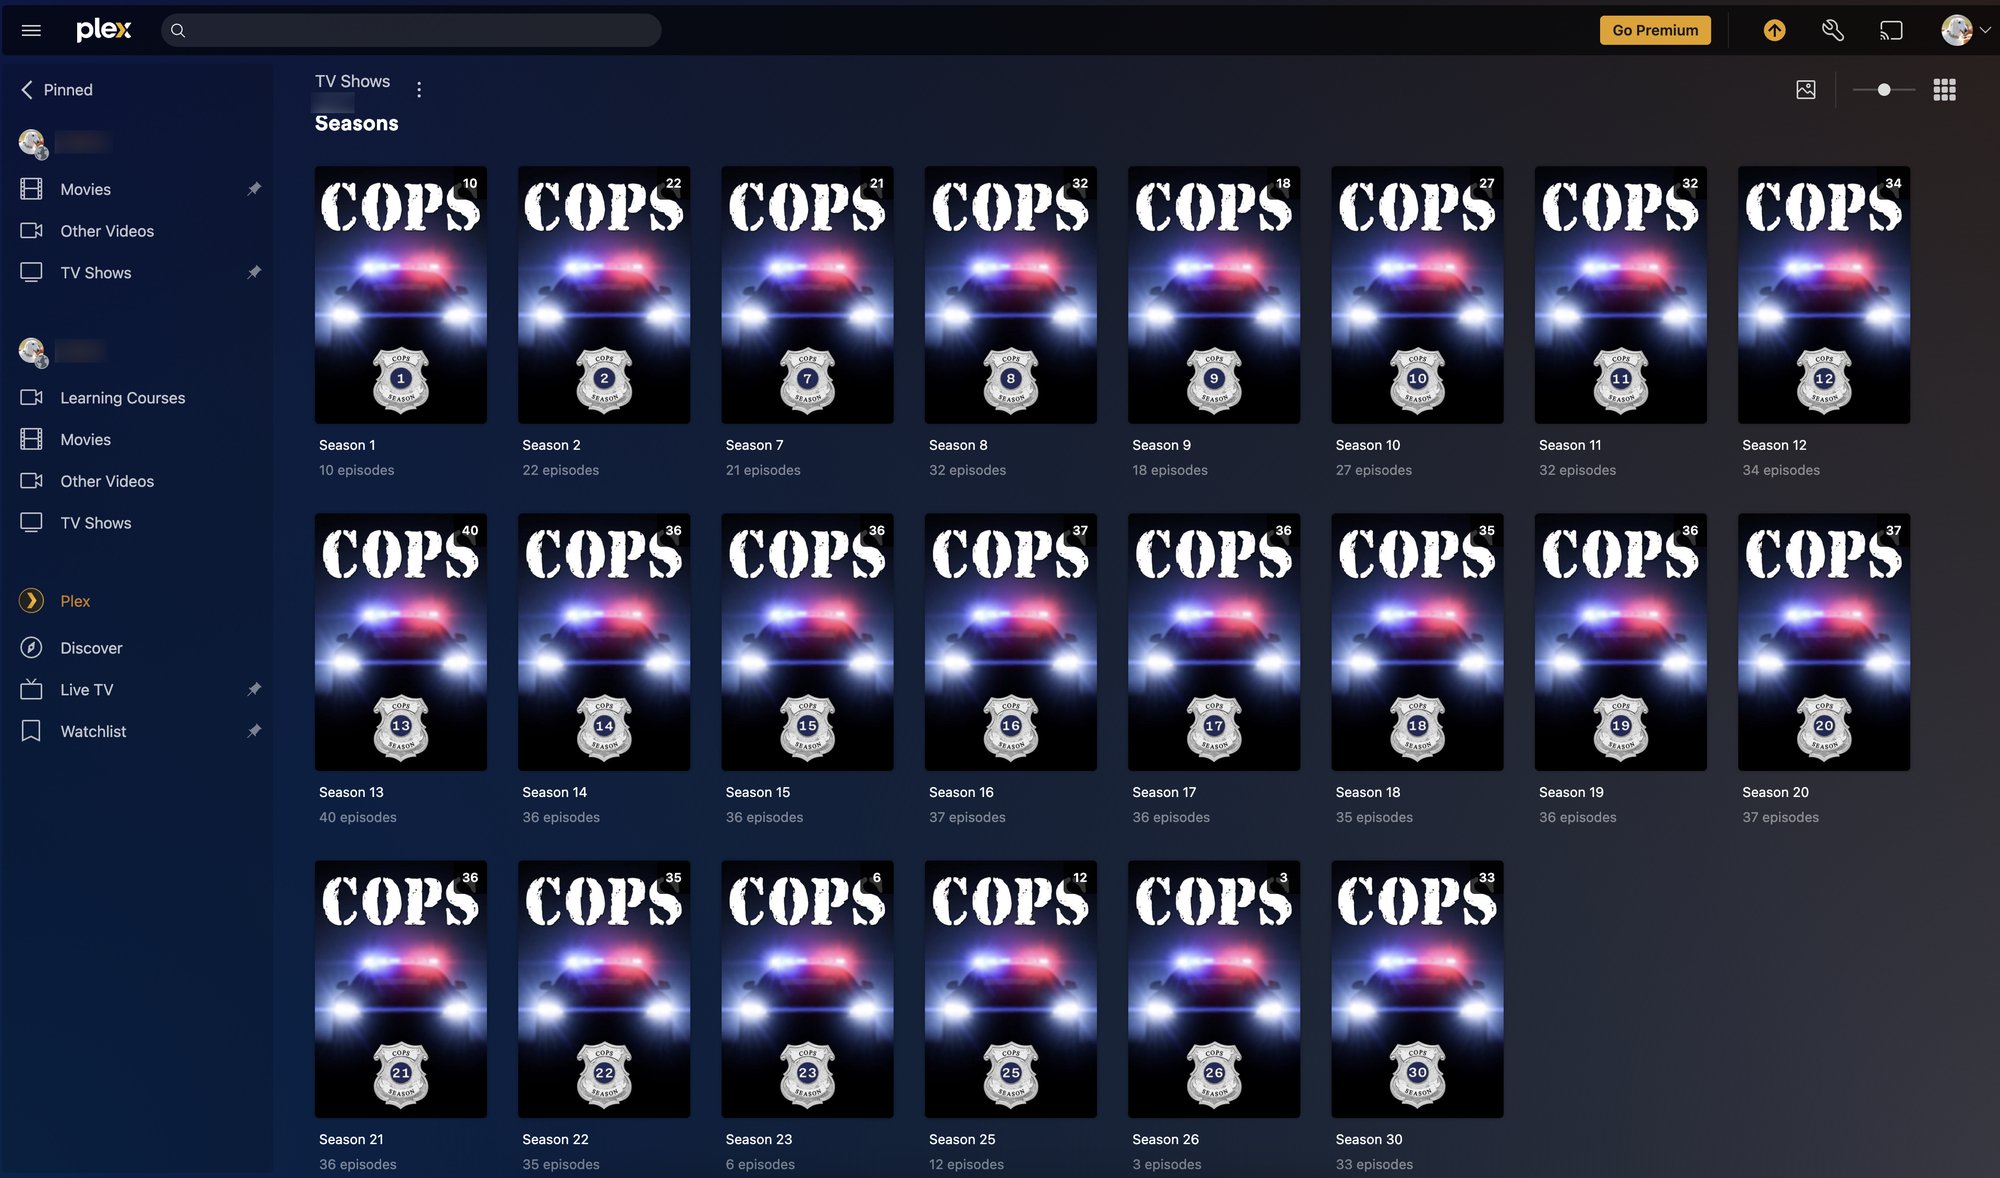
Plex runs on two NAS servers of its own. The library is mirrored between them, so one is always a backup of the other, and spreading the streams across both keeps the throughput up when several people are watching at once. Keeping media on separate hardware also means a movie night never competes with backups or photo sync for disk time, and I can reboot or rebuild the other boxes without the TV going dark.
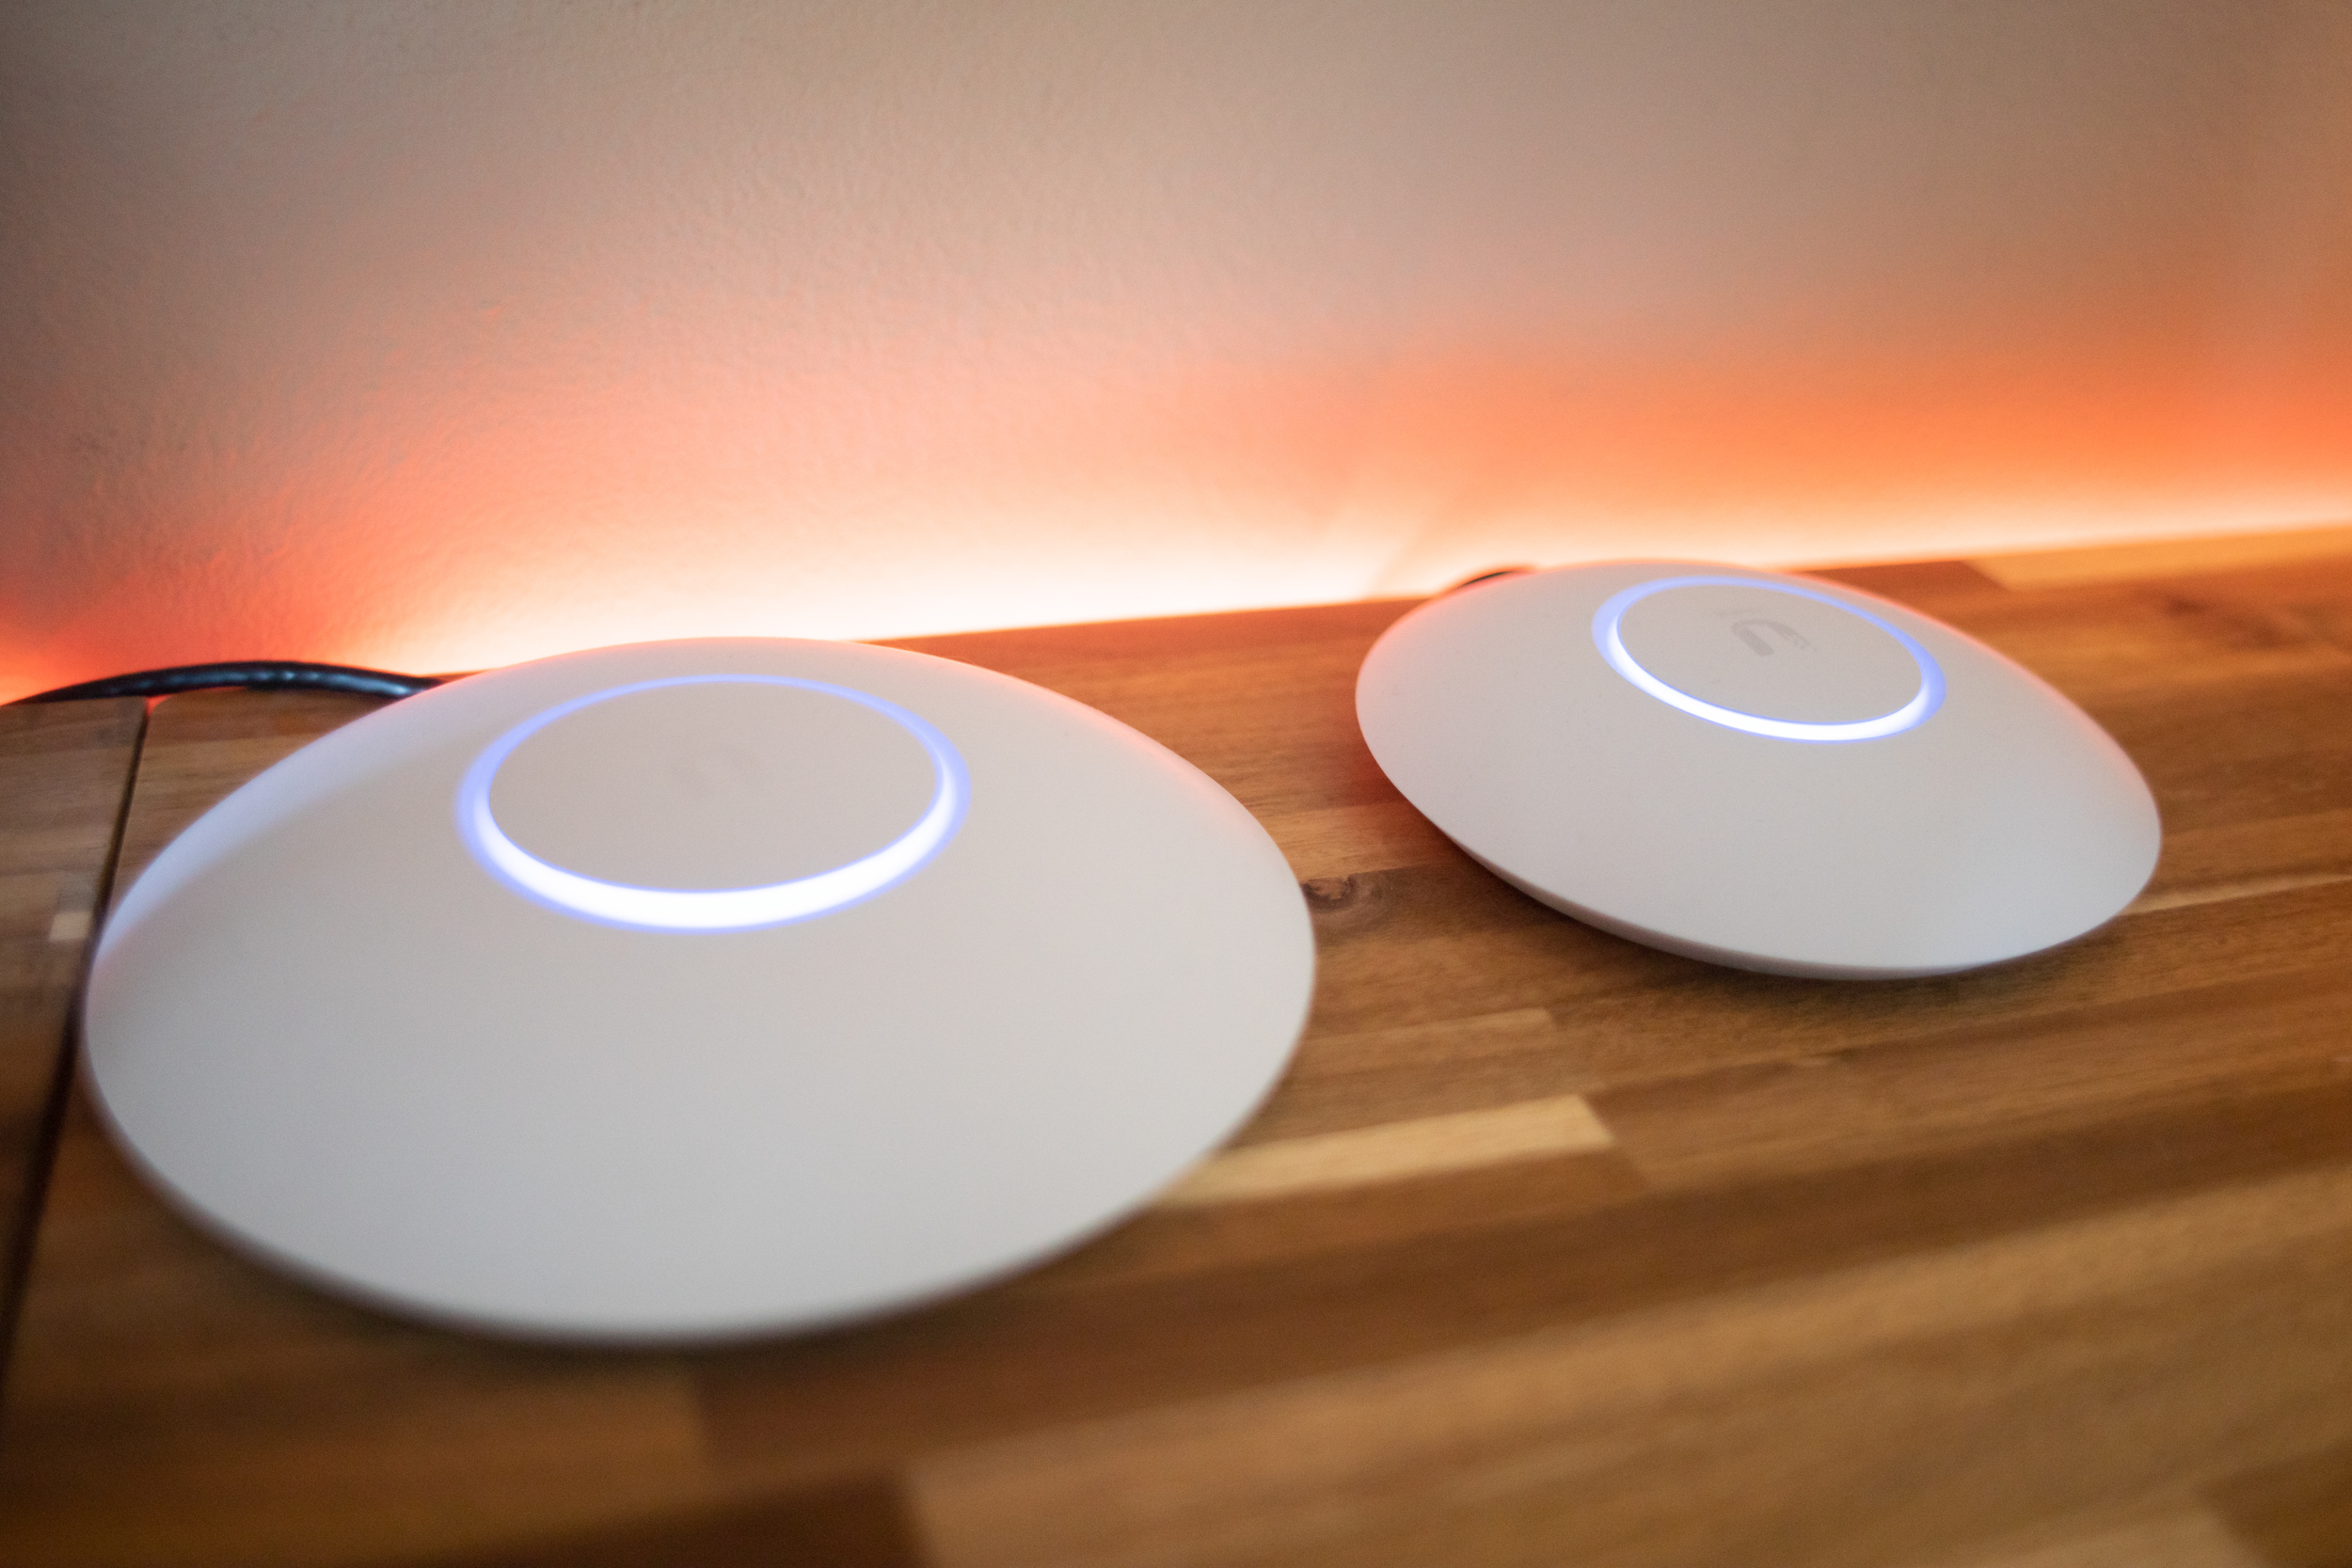
Ubiquiti Wfi 6
Spread around the house I have deployed Ubuquity U6 Pro and U6 Lite routers in mesh mode and band steering which automatically forces devices to use 2.4Ghz or 5Ghz depending on signal strength. I have mixed feelings about these wifi routers. I get better signals with top of the line Asus routers but these report stats well within a full Ubiquiti network
Monitoring with Grafana, Beszel, and Fleet
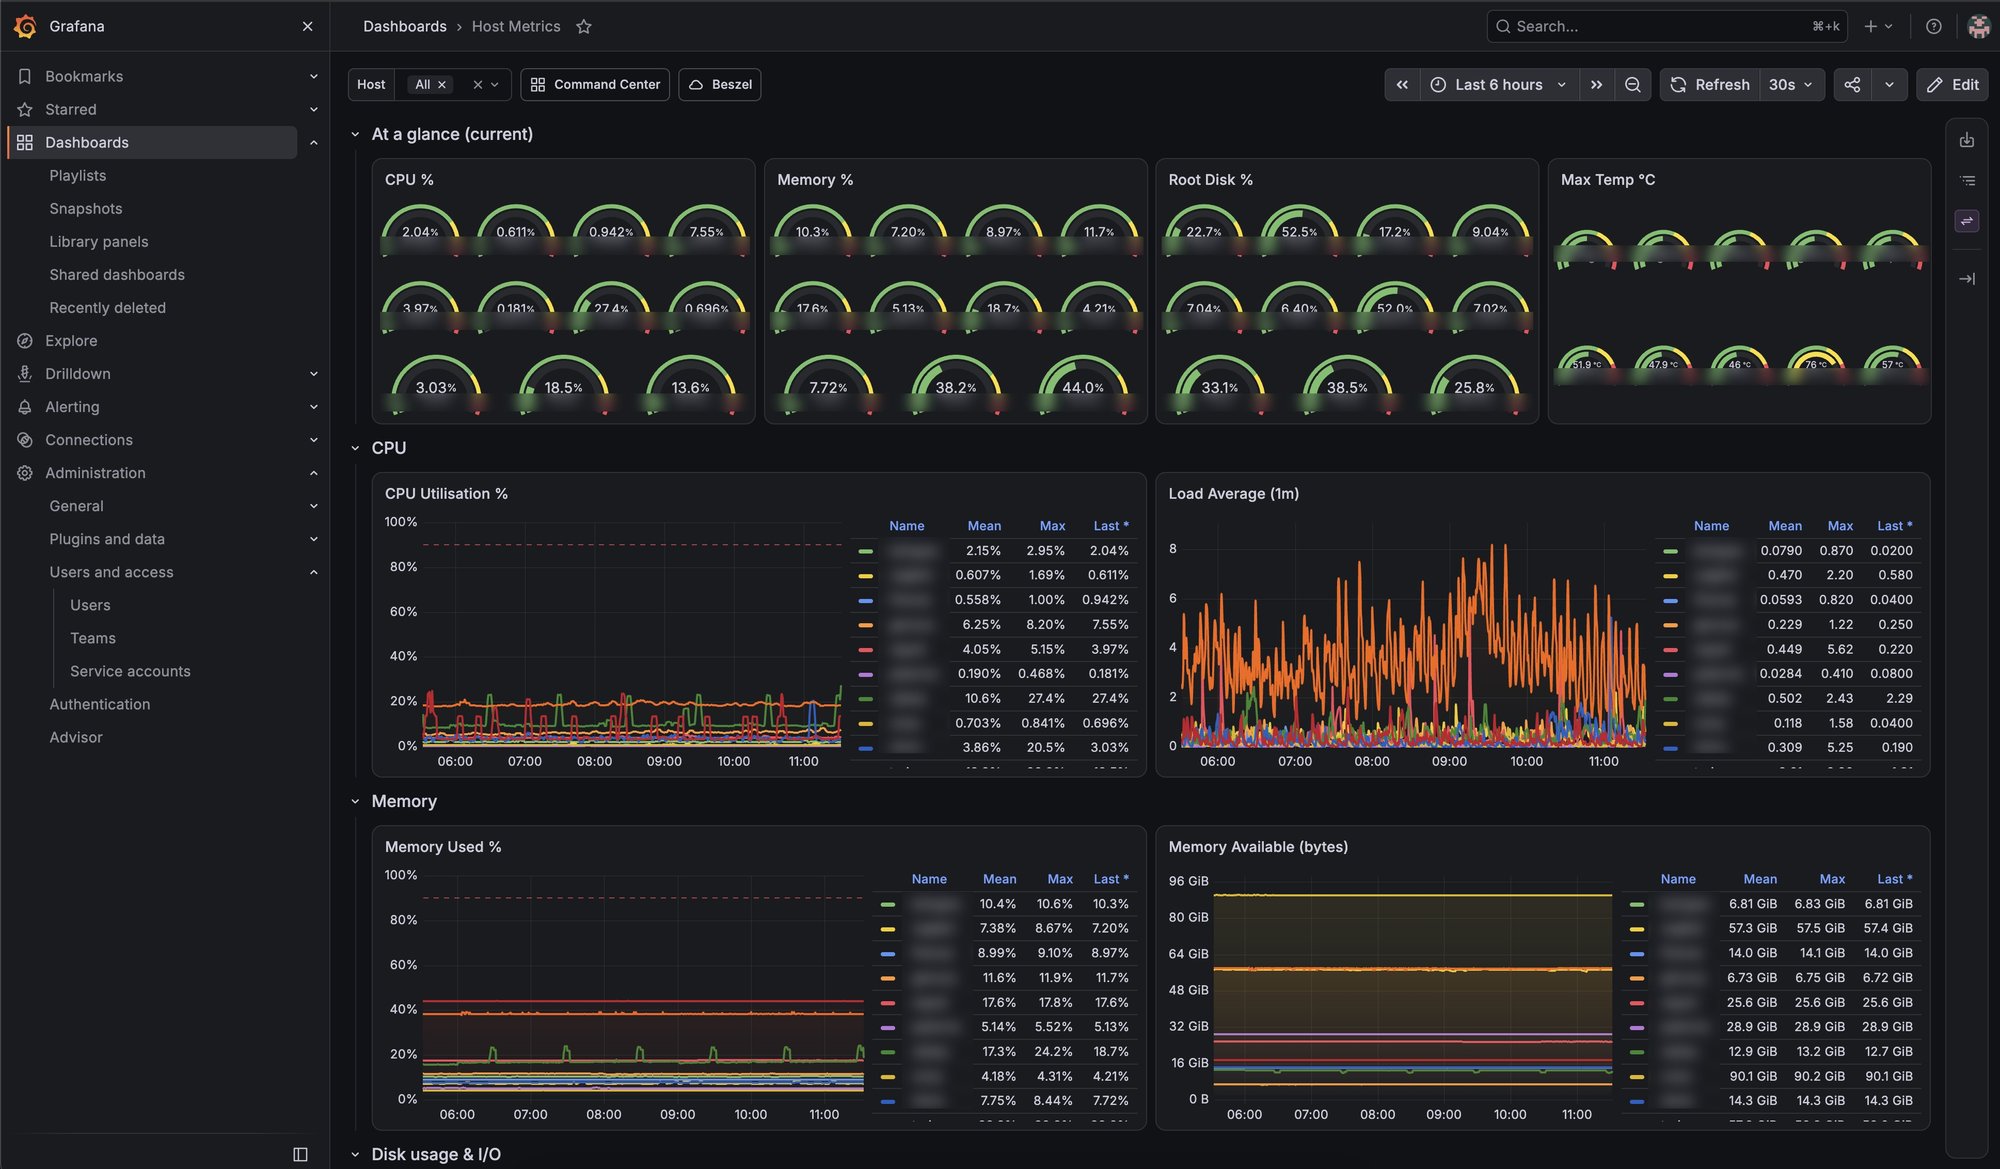
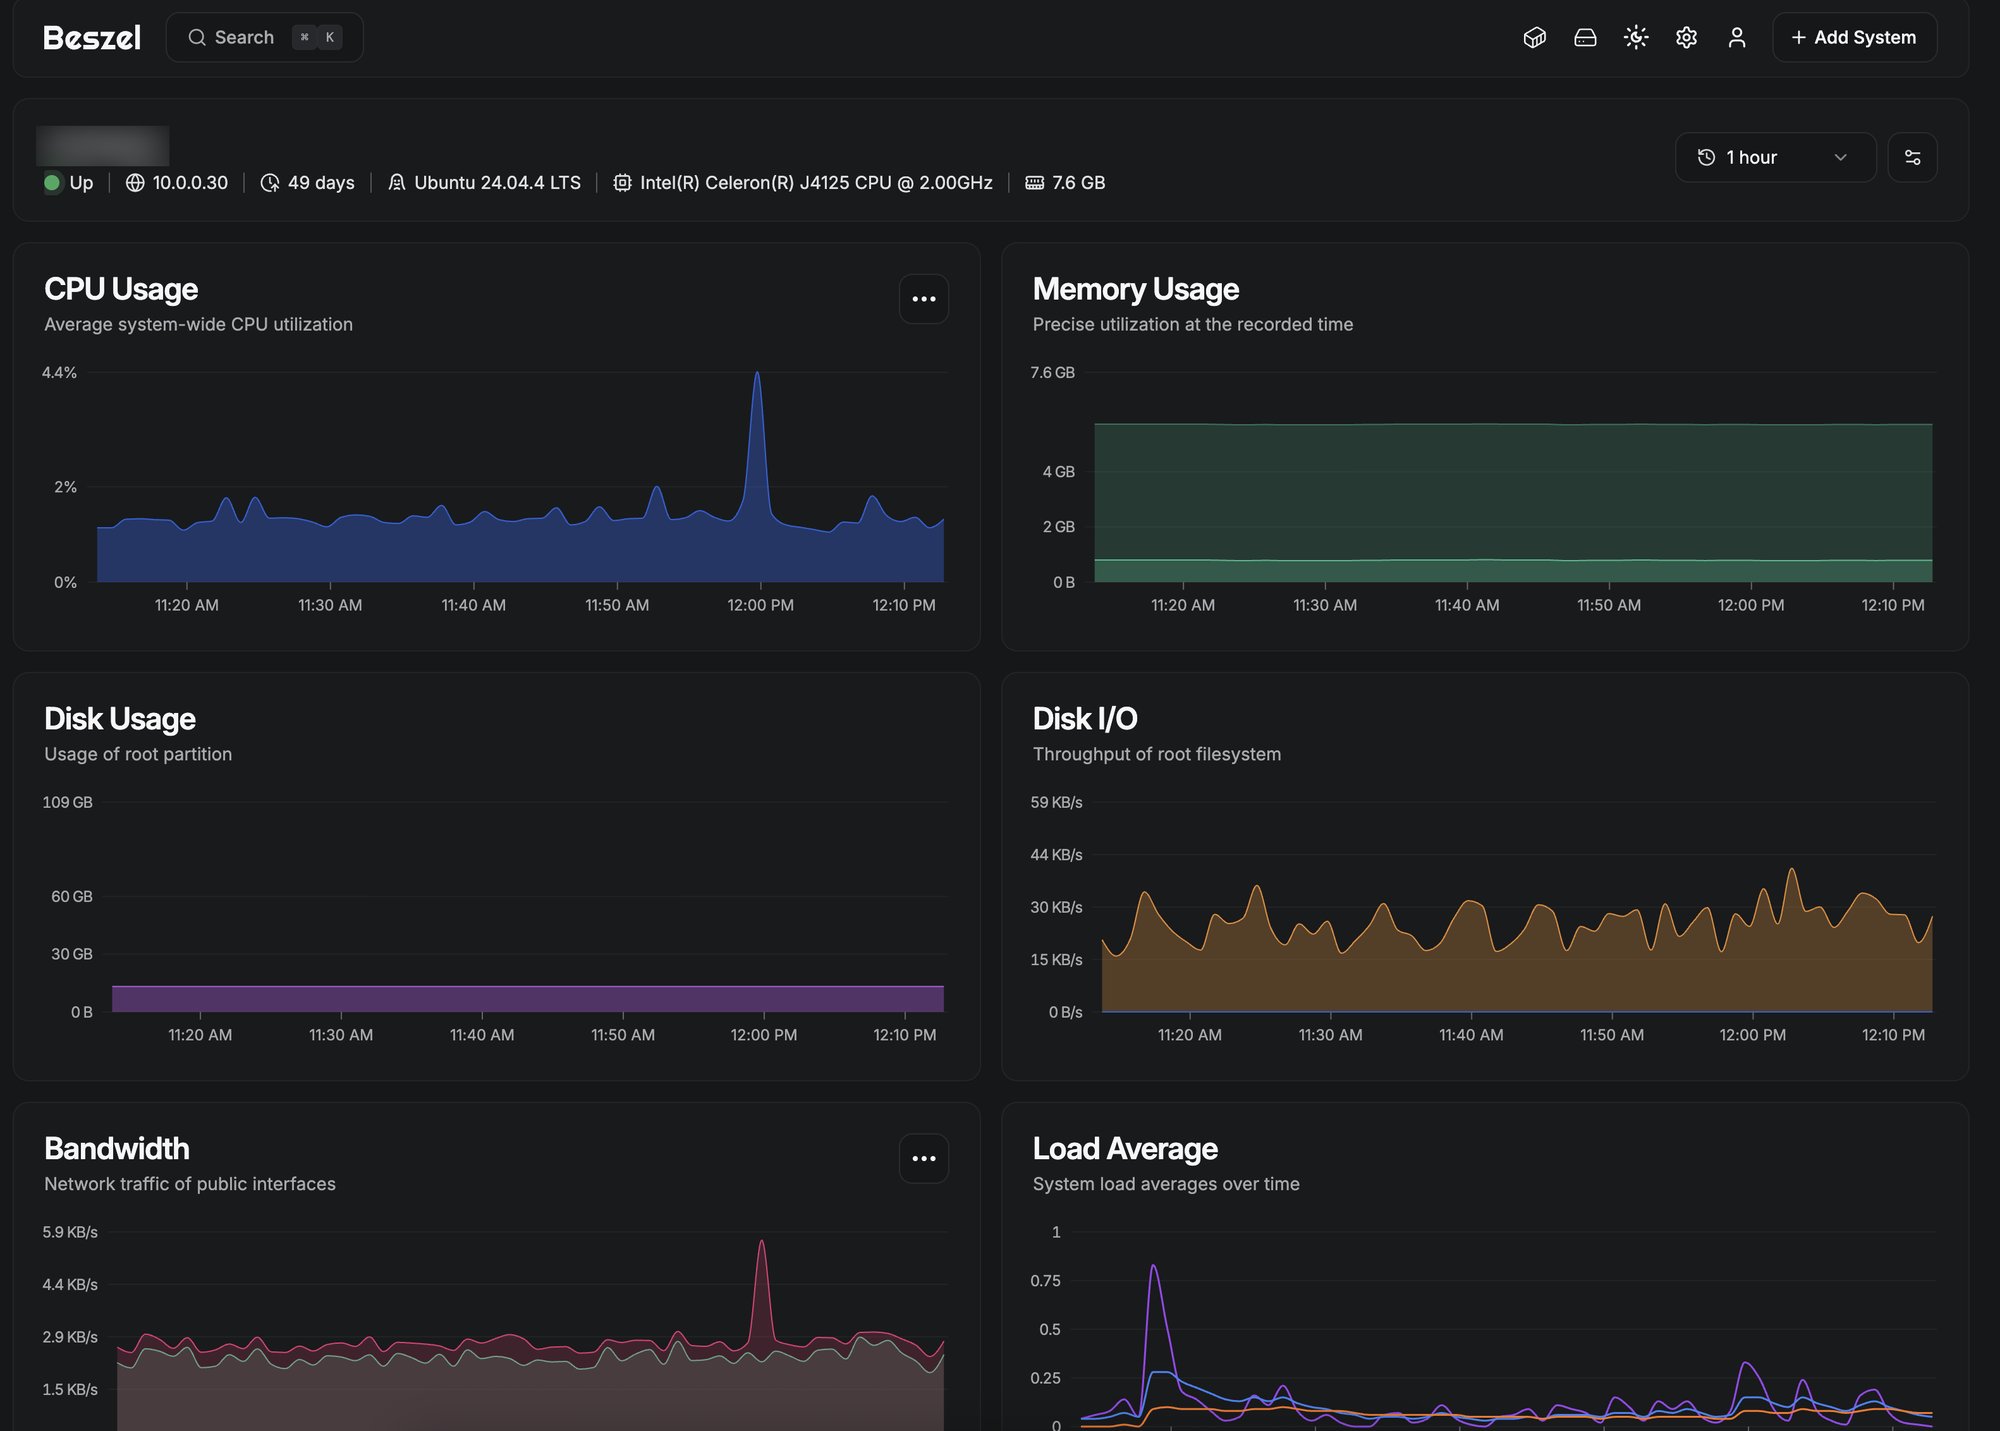
Every server reports to one monitoring box, and three tools split the job. Beszel is a lightweight agent on each host that feeds CPU, memory, disk, disk I/O, bandwidth, and load into per-server graphs, with alerts when something crosses a line. Loki collects the logs. Grafana sits on top of both with a single dashboard that shows CPU, memory, disk, temperature, and load for the whole lab side by side, so when something misbehaves I usually see it here before I notice it anywhere else.
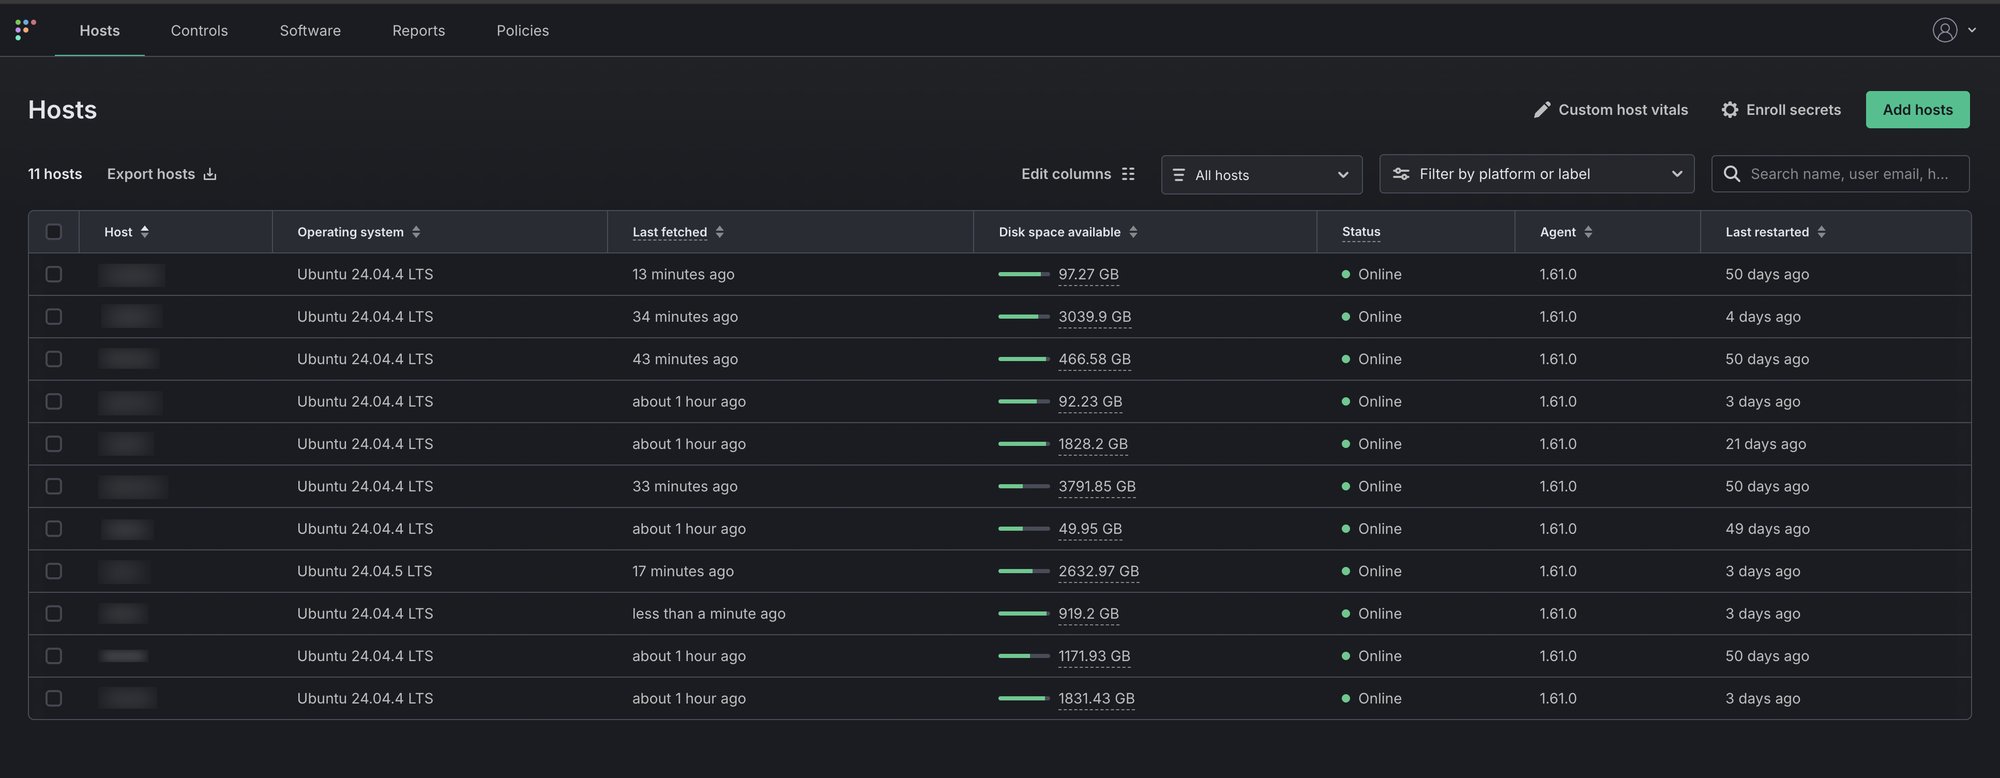
Fleet runs osquery on every machine and gives me the inventory side: which hosts are online, what OS and agent version they run, how much disk is left, when they last restarted, and what software is installed. Policies flag anything that drifts from how I want a box configured, which is the kind of thing I would otherwise only find by logging in and looking.